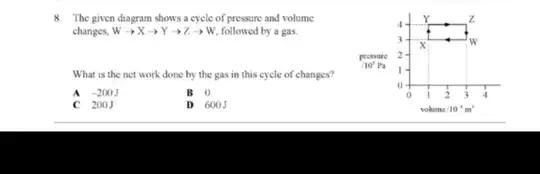
Think about going from X to Y on the diagram.
The volume is constant, but the pressure increases.
Something must be happening to the gas to cause that. One way to make it happen would to add heat energy to the gas and raise its temperature.
The rectangular shape of the pressure-volume diagram doesn't correspond to anything that is physically simple, but you should be able to see that as you go from Y to Z and the volume increases, the gas pressure would decrease unless you continue to add more heat energy to the system and keep the pressure constant as the gas expands.
For the other two sides, Z to W and back to X, the gas is losing heat energy. Don't try to over-think this (because as the previous paragraph said, this diagram doesn't correspond to any simple physical device), but going round the complete cycle, the amount of heat added is not the same as the amount of heat removed.
The net amount of heat added to the system is converted into mechanical work when the gas pressure changes the volume of the system, moving from Y to Z and then from W back to X.
Since the starting and ending conditions at point X are the same, the amount of heat energy added to the system during the cycle is the same as the amount of mechanical work done by the gas.
Similar diagrams (but with curved sides, not straight) are used to understand the behaviour of different types of "heat engines" such as steam engines, gasoline and diesel car engines, jet aircraft engines, etc. Devices where mechanical work is used to remove heat from a system, for example refrigerators and air conditioning systems, can be understood in the same way, moving round a loop on the pressure-volume diagram in the opposite direction.