First of all sorry for my English - it is not my native language.
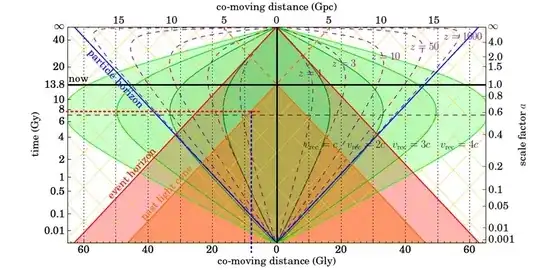
According to the following wonderful diagram made by Pulsar,
the late-time acceleration of the universe began at $t_{acc}=$ 7.7 billion years (indicated by the horizontal black dashed line).
I want to know a co-moving distance ($\mathbf R$) of an object or region that is closest to us, among astronomical objects or regions being accelerated by the late-time acceleration of the universe.
I think that the value ($\mathbf R$) corresponds to the x-coordinate of the intersection of the horizontal black dashed line and the orange thick line, in the above diagram; that is, about 9 Gly.
Q1) Is this interpretation correct?
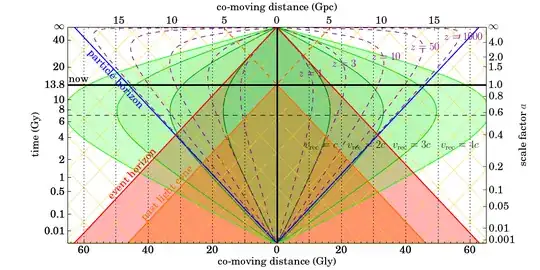
Meanwhile, in order to more precisely indicate $t_{acc}=$ 7.7 billion years, it seem that it is necessary to slightly move up the horizontal black dashed line, as depicted by the red dotted line in the following diagram.
 If so, it seem that $\mathbf R$ should be about 8 Gly, which is indicated by the blue dotted line.
Q2) Which of 8 or 9 Gly is the right value of $\mathbf R$?
In addition, the Pulsar's diagram was made based on the condition that the Hubble parameter is 67.3 (km/s)/Mpc. Does anyone have a diagram made under the condition of 70 (km/s)/Mpc? Or, does anyone know what the value of $\mathbf R$ under the condition of 70 (km/s)/Mpc is?
