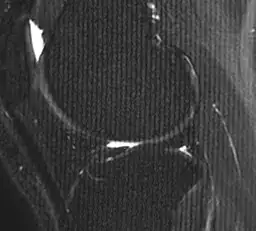
I am trying to find the frequency of the artifact on the MRI image of the knee below both manually and with ImageJ:
As you can see the artifact results in a bar pattern extending horizontally along the image - i.e. a spike artifact.
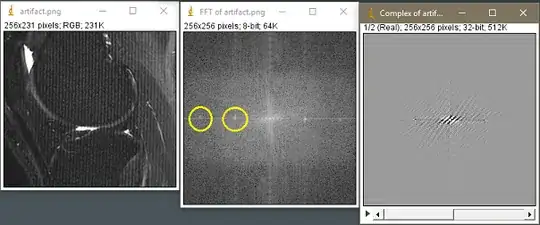
After transforming to Fourier space, there are a couple of dots along the x-axis that seem to stand out in their intensity (yellow circles), and are therefore potential culprits for the artifact:
at frequencies $5.02\text{ pixels/cycle}$ and $2.4\text{ pixels/cycle},$ but the frequency that I calculate visually (and painfully) on the $256 \times 256\text{ pixel}$ image corresponds to $\approx 53 \text{ dark vertical bars},$ which would amount to
$$\frac{256}{53}=4.8\text{ pixel/cycle}$$
This is close enough to the the higher frequency dot in Fourier space ($5.02 \text{ pixels/cycle})$. Is this the explanation for the artifact?
Is there a contribution from the second dot that should be considered?
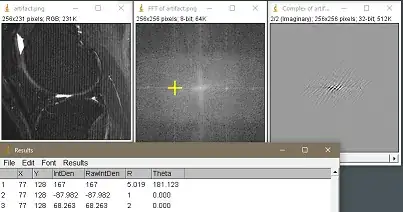
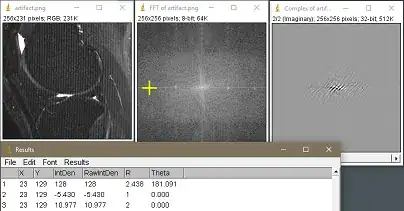
Here is the complete analysis of both dots:
$$\small\begin{align}\text{Freq}&=5.019\text{ pix/cycle}\\ \text{Direction}&=181.12^°\\ \text{Phase }&= \arctan(68.263/-87.982)=-0.6598^°\\ \text{Magnitude}&=\sqrt{(-87.982)^2 +(68.263)^2}=111.36 \end{align}$$
$$\small\begin{align} \text{Freq}&=2.438 \text{ pix/cycle}\\ \text{Direction}&=181.091^°\\ \text{Phase }&= \arctan(10.977/-5.43)=-1.11^°\\ \text{Magnitude}&=\sqrt{(-5.43)^2+(10.977)^2}=12.25 \end{align}$$


