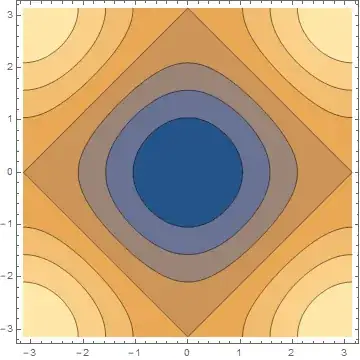
I am making different plots for a 2-d non-interacting tight binding Hamiltonian $$ H = - t \sum_{<ij>, \sigma} c_{i \sigma}^{\dagger} c_{j \sigma} + h.c$$
I get the dispersion relation $$\epsilon (k) = -2 t ( \cos(k_{x} a) + \cos (k_{y} a))$$
Plotting the contours of this, I get many k values giving me the same energy $\epsilon = 0$, that contour looks like a rhombus. I know that this has something to do with nesting but I don't understand exactly what is it.
I'll appreciate referring to good sources on this too. I can't seem to find any that explains this clearly without referring to other things I am not familiar with.
