1

From some simulations I have obtained as an output a signal which roughly looks like a Gaussian with some elevated tails. Note that the input was a Gaussian.

Now I would like to quantify the deviation from the Gaussian, or, to be more specific, I would like to quantify the elevation of the tails. Any ideas how to do that?

(Maybe fitting some kind of "almost-Gaussian" type of function where the elevation of the tails is one of the fit parameter, but what would I use then as "almost-Gaussian" type of function?)
Alf
  • 2,039

1 Answers1

3

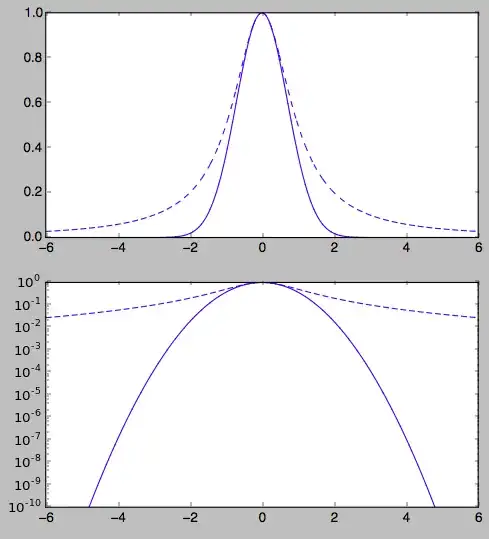
Besides the Gaussian or normal distribution, the Cauchy, or Lorentzian or Breit–Wigner distribution shows up frequently in physics and engineering phenomenon and measurements. While the Gaussian is its own Fourier transform, the Lorentzian is the Fourier transform of an exponential decay for t>0.

Gaussian distirbution (solid line): $exp(-x^2)$

Cauchy distribution (dotted line): $1/(1+x^2)$

Spectral line shapes often sums of Voigt distributions, which are the convolution of a natural Cauchy line shape with an instrumental plus thermal-doppler broadenging modeled as a gaussian shape.

A good goal would be to first try to better understand the physics behind the shape of your distribution then choose functional forms that are representative of what is actually happening. It is possible that you should not expect your signal to be Gaussian shaped in the first place.

enter image description here

uhoh
  • 6,089