For anything but the simplest system, you are likely to get the best result by carefully determining the focal length at a number of different wavelengths. Simulation is quite hard - see this question and associated answers for some ideas for (free) software you could use. But it's hard to do it right.
Instead, if you want to go the experimental route, you could do this in a couple of different ways.
First method: use a white point source at a known distance (it could be "very far away", but that doesn't actually matter). Of course a real source is likely to be extended, but for this experiment to work well you really want to focus it through a small pinhole that is on the optical axis of the lens. Then put a second pinhole at the other side of the lens, and scan the intensity of the light at a few different wavelengths as the pinhole steps through the nominal focal distance. This is most simply done by sending the light through a grating and capturing the resulting spectrum with a camera; but you could also use monochromatic filters at a few different wavelengths, and you can filter the beam at any point. Note, however, that you don't want to place filters between the pinholes and the lenses, as they may affect the optical path length. You have to put the filter either before the first pinhole, or after the second.
If I am not mistaken, you would expect to see the intensity of the light coming through the pinhole peak quite sharply as you go through the focal point; but since the focal point will be different for each wavelength, the peaks will not lie exactly on top of each other. Instead, you will get a plot like this (numbers and shape of curves are made up):
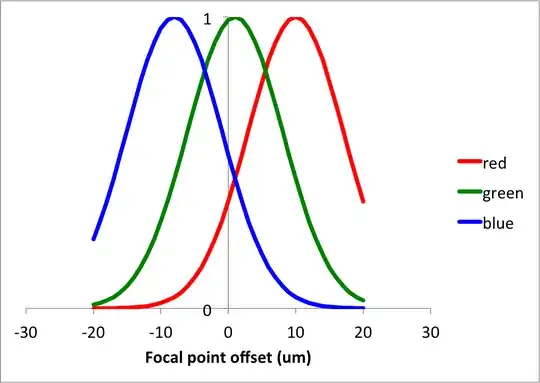
The peaks should be fairly sharp, as long as everything is well aligned and the pinholes are small: when the focal blur is equal to the pinhole size, the intensity will drop by a factor 4x. Therefore it should be easy to determine the focal length for each wavelength. You should be able to make a plot of focal length as a function of wavelength. For a well compensated lens, that plot will be (nearly) flat; the example graph I gave above corresponds to a lens with a lot of uncorrected dispersion.
Once you have that relationship, you determine the point of least confusion based on your needs.
For example, if you have all wavelengths evenly represented in your source, you will want to put the POLC at the unweighted mean of all focal lengths; but if you have a predominantly red image, for example, you will want to use a heavier weight for the red focal length than for the blue.
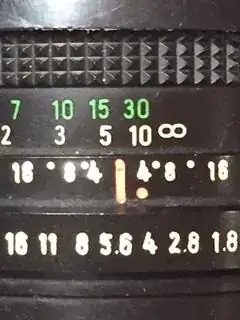
I am reminded of a camera I had many years ago that had manual focus (using a TTL microprism). The lens had an "IR" marking on it - so that if you wanted to do IR photography, you would first focus on the visible light, then make a small adjustment to move the focus setting to the IR dot. Of course IR is somewhat more extreme - but that's an example of what needs to be done to get focus right "for the wavelength of interest" (in this image, the camera is focused at 10 m in the IR, 6 m in the visible).
Note - chromatic aberration occurs both on the optical axis, and off it. You notice it more strongly off axis, because it results in characteristic colored fringes at points of sharp contrast. What you are really seeing with such fringes is the fact that with different focal lengths, images are of slightly different size; and the further to the edge you look, the greater the difference in size will be.
Incidentally, the diagram you use in the question seems to relate to spherical aberration; what I described above relates to chromatic aberration. Both of these things matter if you really want the best focus; and both are diminished by using a smaller aperture lens (bigger f-number).


