50

If a blackbody has a temperature such that its peak frequency was well within our audible range, for example $1\ \mathrm{kHz}$, what would that sound like if we used Planck's law to plot its spectral curve in the frequency domain and performed a transformation (like an inverse FFT) to obtain a waveform?

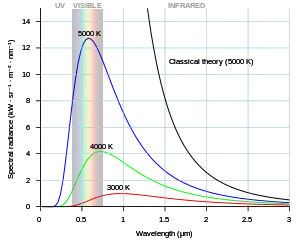
Planck's law tells us the peak wavelength and electromagnetic spectral emission curve of an ideal radiator an some temperature $T$.

If we know the peak frequency, $f$, then we can work backwards to figure its peak wavelength, $\lambda$. For our example, if $f=1\ \mathrm{kHz}$, then $\lambda\approx170\,471\ \mathrm m$, so $T\approx17\ \mathrm{nK}$.

If we plot the power spectral density of a 17 nanokelvin blackbody as a function of frequency and performed an inverse FFT on that curve, what would the resulting waveform sound like?

According to this Wikipedia article, blackbody radiation is just thermal noise (Johnson–Nyquist noise); if that's what I'm looking for, what does it sound like? Just to clarify, I'm looking for a waveform, maybe a WAV file, rather than a verbal description.
ayane_m
  • 1,108
  • 1
  • 10
  • 17

3 Answers3

56

This problem can be solved with noise-shaping. Since the shape of the spectrum is known, it can be used as a base for the power spectral density:

$$ P(f,T)=\frac{ 2 h f^3}{c^2} \frac{1}{e^\frac{h f}{k_\mathrm{B}T} - 1} $$

where $k_\mathrm{B}$ is the Boltzmann constant, $h$ is the Planck constant, and $c$ is the speed of light. This outputs the relative power of each band as a continuous function of frequency, $f$, and temperature, $T$. Since the output quantity must be expressed in decibels (dBr) to be meaningful for audio, we simply use a log scale and add an offset (a gain) to normalize the peak to 0. The equation of the EQ curve is:

$ E(f,T) = 10 \log{ P(f,T) } + G_{t}(T) $

where $G_{t}(T)$ is the gain required to normalize the peak to 0 dB. The required gain depends on the inverse cube of the temperature plus a constant, $G$ (187 dB); thus, $ G_{t}(T) = G - 10 \log T^3 $. The leading coefficient $10$ converts bels to decibels. Simplifying gives us:

$$ E(f,T) = 10 \log{ \left( \frac{ 2 h f^3}{c^2 T^3} \frac{1}{e^\frac{h f}{k_\mathrm{B}T} - 1} \right)} + G $$

tl;dr:

We obtain our waveform by applying an EQ to gaussian white noise from AudioCheck.net.


Examples:

  1. 17 nanokelvins is the temperature at which black noise has a peak frequency of 1 KHz. Its passband is limited to 1 Hz to 12 KHz.

  2. 30 nanokelvins is the lowest temperature at which black noise has a passband that spans the entire hearing range.

  3. 55 nanokelvins is the temperature at which black noise has a peak frequency of approximately 3 KHz, the most sensitve frequency of human ears.

  4. 340 nanokelvins is the temperature at which black noise has a peak frequency of just under 20 KHz, which is the limit of human hearing. Most of the audible spectrum is a linear upward ramp, which is very similar to violet noise. At higher temperatures, the frequency domain will be almost identical to violet noise.

All EQ filter parameters are in the descriptions of the tracks on SoundCloud.

ayane_m
  • 1,108
  • 1
  • 10
  • 17
5

If you are cooling your object that you wish to hear, then the exact sound will depend on the exact temperature (as given by yuki96's answer at 17nK).

However, any temperature above the nanoKelvin temperature scale will sound the same, but the volume will increase with temperature (according to the Stefan-Boltzmann law).

The sound of a warm blackbody (such as what you would get at room temperature) would sound like a violet or purple noise. You can listen to a sample of purple noise here.

-5

What does a blackbody sound like?

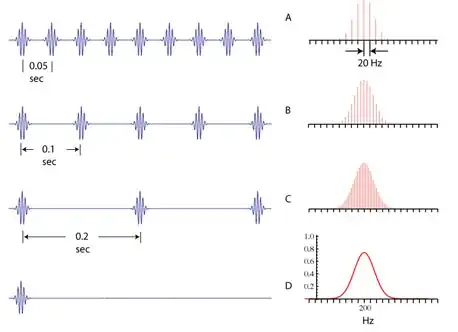
It will sound like a musical note. Any spectrum looking like a bell is a musical note with a lot of harmonics. The narrower the bell the purer the musical note. If the bell is wide the ear perceives the sound more like a pop because the wider the spectrum the shorter its time image gets.

Planck's law

Planck's law

To be more precise, the inverse Fourier transform (the signal as a function of time) of a spectrum having the shape of a bell (like Plank's diagram) looks like in the image below, row no. 4 from the top.

Continuous and discrete spectra

Continuous and discrete spectra

Because I am seeing there are people who do not understand, the spectrum of a finite duration signal (a real musical note for instance) is continuous. Only repetitive signals have discrete spectra. If the musical note is played continuously its spectrum is discrete if not, and this is the case in practice, the spectrum is continuous.