7

I would really appreciate if someone could explain.

What does a correlation function like a density-density correlation function $$C_{nn}(\vec x_1, \vec x_2)= \langle n(\vec x_1) n(\vec x_2)\rangle$$ measure, or what does it mean as a function? By this i don't mean what the interpretation of the result is but what does it do mathematically?

And even more important how does it do this. If someone could explain this in general terms general functions of randomly variables it would be very helpfull.

I know about this question but none of the answeres really describes what generally a correlation function signifies or how it does this mathematically. But this is exactly what i need to know. Shurely there must be a way to proove or at least understand this completely theoretically.

I know that the correlation is defined as covariance function normalized as in wikipedia. The normalization seemes to always be missing in physics. Is this because we just use normalized random variables?

Kuhlambo
  • 950

4 Answers4

15

The correlation function measures, as you would expect, how correlated two random variables are. That is, how often two random variables have similar values.

We can construct such a function very simply. Say you are flipping coins, and you want to know if their results are correlated. To quantify things, call "heads" $+1$ and "tails" $-1$. To make things concrete, lets say the results from flipping each coin 5 times are: $$ \begin{align} \text{Coin } A:&\ +, -, -, +, - \\ \text{Coin } B:&\ -, -, -, -, + \\ \text{Coin } C:&\ +, -, +, +, - \\ \text{Coin } D:&\ -, +, -, -, + \\ \end{align} $$ To measure how "correlated" the a pair of results are, we want a function that is positive when the two results are similar, and negative when they are dissimilar. The easiest function is multiplication: it will be positive when the coins have the same result (++ or --) and negative when they differ (+- and -+). We can multiply each trial, then average the results to get an overall estimate of how similar the results are: $$ \begin{align} C_{AB} &= \frac{-1+1+1-1-1}{5} = 0.2 \\ C_{AC} &= \frac{+1+1-1+1+1}{5} = 0.6 \\ C_{AD} &= \frac{-1-1+1-1-1}{5} = -0.6 \\ \end{align} $$ So $A$ and $B$ seem pretty uncorrelated, $A$ and $C$ may be correlated, and $A$ and $D$ are anti-correlated.

The principle is exactly the same in statistical mechanics. You have two sets of random variables, the density at $x_1$ and the density at $x_2$. The variables are random, because you don't know what the exact density field $n(x)$ is, you only have a probability distribution (e.g. Boltzmann) over many possible $n(x)$'s. To calculate the correlation of $n(x_1)$ and $n(x_2)$, multiply them for every realization of $n(x)$ and average the results. We write this as: $$ C_{nn}(x_1, x_2) = \langle n(x_1) n(x_2)\rangle $$

Now, you mentioned the covariance in your comment. It could be that for your problem $C_nn(x_1, x_2)$ does not give you the information you want. Perhaps $\langle n(x_1)\rangle$ and $\langle n(x_2)\rangle$ are different, but both large and positive. Then the average you do in $C_{nn}$ will be dominated by just multiplying the average density of both fields. In cases like this, you may be interested not in the correlation of $n(x_1)$ and $n(x_2)$ themselves, but in correlations of their fluctuations from equilibrium: $n(x) - \langle n(x)\rangle$. This correlation function is the covariance! $$ \begin{align} C_{n-\bar{n},n-\bar{n}}(x_1, x_2) &= \Big \langle \big (n(x_1)-\langle n(x_1) \rangle \big ) \big (n(x_2)-\langle n(x_2) \rangle \big ) \Big \rangle \\ &= \Big \langle n(x_1)n(x_2) \Big \rangle - \Big \langle n(x_1)\langle n(x_2)\rangle \Big \rangle - \Big \langle \langle n(x_1) \rangle n(x_2) \Big \rangle + \langle n(x_1)\rangle \langle n(x_2) \rangle \\ &= \Big \langle n(x_1)n(x_2) \Big \rangle - \Big \langle n(x_1)\Big \rangle \Big \langle n(x_2) \Big \rangle \\ &= Cov(n(x_1),n(x_2)) \end{align} $$
Geoff Ryan
  • 1,818
2

This answer is already 8 years old so I hope I can help new people with this answer.

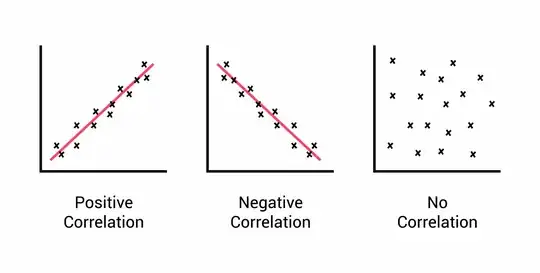
A correlation function basically tells you how much the outcome of one variable tells you about another variable. This is shown nicely here:

enter image description here

If I measure a quantity $A$ that has positive/negative correlation with quantity $B$ I can make a prediction about $B$ with some certainty. How stronger the correlation, how better my prediction will be.

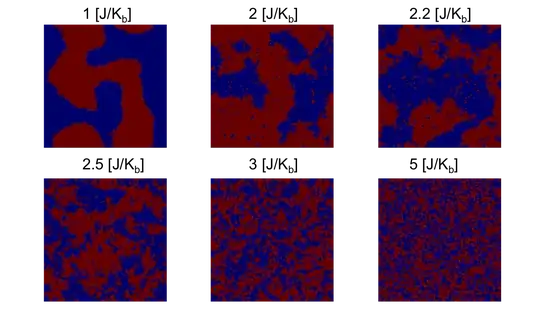
The correlation function in physics applies this to field, i.e. quantities which are defined for all points in space. In this case, the correlation function tells you how much a fluctuation in one point in space is correlated with another point. The first time this really clicked with me was while staring at pictures of the Ising model. The Ising model describes a field of spins where each lattice site is either $+1$ or $-1$. Based on the interaction strength $J$, each lattice site tries to either align or anti-align with its neighbours. A few snapshots are shown here:

enter image description here

Let's look at $J=2.5/K_b$ for example. The fluctuations are in the form of little islands, which are roughly the same spin. How do you describe the size of these islands mathematically? Using the correlation function! Within the size of a typical island, the correlation function is non-zero. Outside this range it quickly decays to zero. For $J=5/K_b$ the fluctuations are more severe and this causes the islands to become very small. The correlation function decays more quickly. In the limit $J\rightarrow\infty$, this becomes just noise and the value on one lattice site tells you nothing about the neighbouring spins.

Note that for the Ising model we look at the truncated correlation function, which is shifted to lie around the mean value: \begin{align}C(i,j)&=\langle (\sigma_i-\langle\sigma_i\rangle)(\sigma_j-\langle\sigma_j\rangle)\rangle\\ &=\langle \sigma_i\sigma_j\rangle-\langle\sigma_i\rangle\langle\sigma_j\rangle\end{align} The correlations go to zero for $J\rightarrow0$ as well. Even though the islands themselves are getting bigger, the size of fluctations is getting smaller and this is reflected in the correlation function as well.

Source image 1:https://www.simplypsychology.org/correlation.html

Source image 2: http://www.bdhammel.com/ising-model/

0

I had the same question and did not find a totally satisfactory answer. However, my guess is that in Physics, theory is almost always dealing with normalized variables, as equations need to be exact and probabilities are always normalized. Covariance is a practical approximation of correlation functions that generalizes the concept to real measurements that are not necessarily normalized. For getting practical bounded correlation values (between -1 and 1), the covariance is divided by variances of each variable. In Physics many "states" are just defined as binary 0 or 1, or -1,+1 (and in some probabilistic examples, such as the dice or coin tosses) which make the averaging process already normalized between 0 and 1. Note that averaging is the same as integrating using a probability density (the case of the dice, the density is constant equals 1/6), so this could also explain why in physics these correlations are bounded. However, I am not sure this means that the correlation in physics is the same as mathematical statistical correlation, which is also normalized by the variance of the variables. I think they are two different magnitudes and this is just a problem of terminology.

0

For fermions, $\langle n(\vec{x}_1)n(\vec{x}_2)\rangle$ can be interpretated as the probability amplitude for finding a fermion at $\vec{x}_1$ and another at $\vec{x}_2$ simultaneously. This is my understanding from P. Coleman, Page 202. For boson the story is similar.

thone
  • 1,873