8

enter image description here

According to this pie above and for the "Red Dwarfs" part, which of these is correct:

  1. 41% of the stellar mass of a galaxy is in stars with masses < $0.25$ $M_{\odot}$ or

  2. 41% of the total number of stars of a galaxy is stars with masses < $0.25$ $M_{\odot}$?

In other words, is this a distribution of mass, so 100% means the stellar mass? Or it is a distribution of the mass among the the number of stars, so 100% means total number of stars?

blademan9999
  • 3,051

4 Answers4

8

The stellar mass distribution is the distribution of numbers of stars within a range of masses in a galaxy (or cluster or what have you), not the mass of the stars. So if you looked at the $\sim10^{11}$ stars in the galaxy, you would observe that about $4\times10^{10}$ of them will have a mass less than 0.25 $M_\odot$, and so on with the rest of the masses.

Using, an initial mass function, for example the Kroupa IMF, we can determine the number of stars within a particular range of masses. If you then compute, for the < 0.25 $M_\odot$ stars, $$ N_{<0.25}=\int_{0.013}^{0.25}\xi(m)\,dm\sim0.44 $$ which is pretty close to your 41% (the lower integration limit comes from here). It's likely that using a different IMF was used to produce your image.

Kyle Kanos
  • 29,127
3

According to this source, 100% is the number of stars, not the total mass. Same from another source. The reason is that they usually calculate these pies straight from the H-R diagram. The H-R diagram plots individual stars and shows how stellar mass varies along the main sequence.

Actually the mass distribution tends to reverse. Even if larger stars are less numerous they concentrate the larger amount of mass. The total mass grows with the star mass at least up to 3 solar masses, see here

enter image description here

3

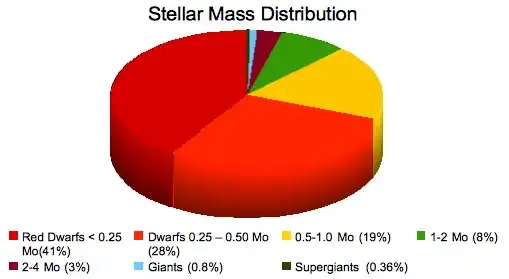
The answer is that 41% of the stars have masses below 0.25$M_{\odot}$.

To check this I integrated the Kroupa initial mass function. This is that $N(m)$ the number of stars per unit mass is proportional to $m^{-1.3}$ for $0.08<m/M_{\odot}<0.5$ and proportional to $m^{-2.3}$ for higher masses.

If I integrate this I find that the ratio of stars with 0.08-0.25$M_{\odot}$ to those with 0.25-0.5$M_{\odot}$ to those with 0.5-1$M_{\odot}$ is 3.64:1.68:1 - which is roughly consistent with the pie chart, where the ratios are 2.15:1.47:1 The differences might be explained by a slightly different lower mass limit for the lowest mass bin, or perhaps a different IMF.

On the other hand if I integrate $mN(m)$ over the same limits I get a ratio of mass contained within stars between these limits in the ratios 0.78:0.89:1 which is clearly inconsistent.

The comparison at higher masses is dependent on what is assumed for the star formation rate - i.e. you need to account for evolution and use the present day mass function rather than the initial mass function.

ProfRob
  • 141,325
0

I am a very late arrival to this post. You noted that the portion of super giants is about 0.36 percent, or 360,000,000 currently in the Milky Way. If at any given time, there were about 360 million super giants in the Milky Way (one might expect that there were more at an earlier age) and their average lifespan is only about 20 million years, then in the 13.4 billion years since hydrogen atoms formed, there have been 13.4 X 10E9 / 20 X 10E6 = 670 generations. That leads to 670 X 360,000,000 = 240 billion solar-mass black holes have been created in the Milky Way. Only 4 million have migrated to the galaxies SMBH. Perhaps many (half?) have been flung out of the galaxy. That still leaves 120 billion solar-mass black holes currently residing in our galaxy. If, however, one starts from the 100 billion stars currently estimated in the Milky Way, and assumes (without reference) that there might be 1 billion solar-mass black holes among those stars, whose predecessor super giants had average lifespans of 20 million years (670 generations), then the average population of super giants has been 10E9 / .67 x 10E3 = 1.5 million, or 0.0015%--not 360 million at 0.36%.