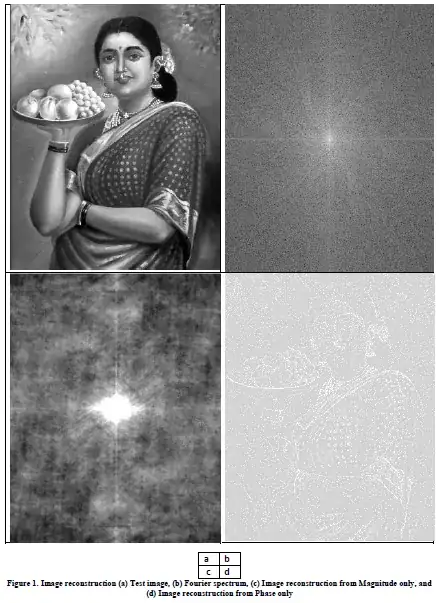
Spectral Power – Image B (top right).
The nature of images C and D is explained by the spectral power image, B.
You can see from spectral power image that most energy is concentrated at low frequencies (the brighter middle part of the image). The higher frequencies (moving away from the centre) have less energy in them because there is less brightness in this part of the image.
This kind of power spectrum is typical in natural images. The drop off in energy with frequency tends to be a good fit to an exponential function.
Energy Image – C (bottom left)
Given this, image C (bottom left) makes sense. You would expect to see blobby shapes that are prevalently low frequency, because that's where the power is in the image. It's symmetry is due to the phases being all all set to zero.
Phase Image – D (bottom right)
You have provided the function used to reconstruct the phase only function. If you take out the summations and basis functions, you are left with:
F_phase_only(u,v) = F(u,v) / |F(u,v)|
F(u,v) is a complex number with phase and magnitude. You are dividing by the magnitude to eliminate it – to make it be 1 for all components. So, F_phase_only(u,v) just has the phases. The magnitude of F_phase_only(u,v) = 1, for all u,v.
Now, look at the spectral image again (top right). This is really just a plot of |F(u,v)| – it's a magnitude only image.
We can see that for small u,v, the low frequencies that are at the middle of the image, |F(u,v)| is large, because the middle is bright.
For larger u,v the higher frequencies that are away from the middle, |F(u,v)| is relatively small, because these parts of the image are darker.
So, returning to F_phase_only(u,v), I will re-write it very subtly.
F_phase_only(u,v) = F(u,v) . BOOST(u,v).
What is boost?
BOOST(u,v) = 1 / |F(u,v)|
What can we determine about the nature of BOOST?
For small u,v the low frequencies, BOOST(u,v) must be a small number. It must be small, because BOOST is the reciprocal of the magnitude. We know from the spectrum that the magnitude is large for low frequencies. Thus, BOOST(u,v) must be small and thus diminishes low frequencies.
For larger u,v the high frequencies, BOOST(u,v) must be a large number. It must be large, because BOOST is the reciprocal of the magnitude. We know from the spectrum that the magnitude is small for high frequencies. Thus, BOOST(u,v) must be large and thus enhances high frequencies.
So the "phase only" image gives all frequency domain components the same magnitude. For an individual component taken relative to the others, this enormously emphasises a higher frequency components and greatly diminishes low frequency components.
So, while you have called it a "phase only image", really it's an image where high frequency terms are enormously enhanced at the expense of low frequency terms.
For this reason, the resulting image shows the edge like features that exist in the magnified higher frequencies.
A Fairer Phase image
Given the paper I mentioned previously, you could prepare a fairer phase image.
F_fairer_phase(u,v) = Expected(u,v) . F(u,v) / |F(u,v)|
Where Expected(u,v) is the statistically expected spectral power at u,v – left as an exercise :-)
Alternatively you could derive Expected(u,v) by averaging over all |F(w,x)| where sqrt(w.w + x.x) = sqrt(u.u, v.v).