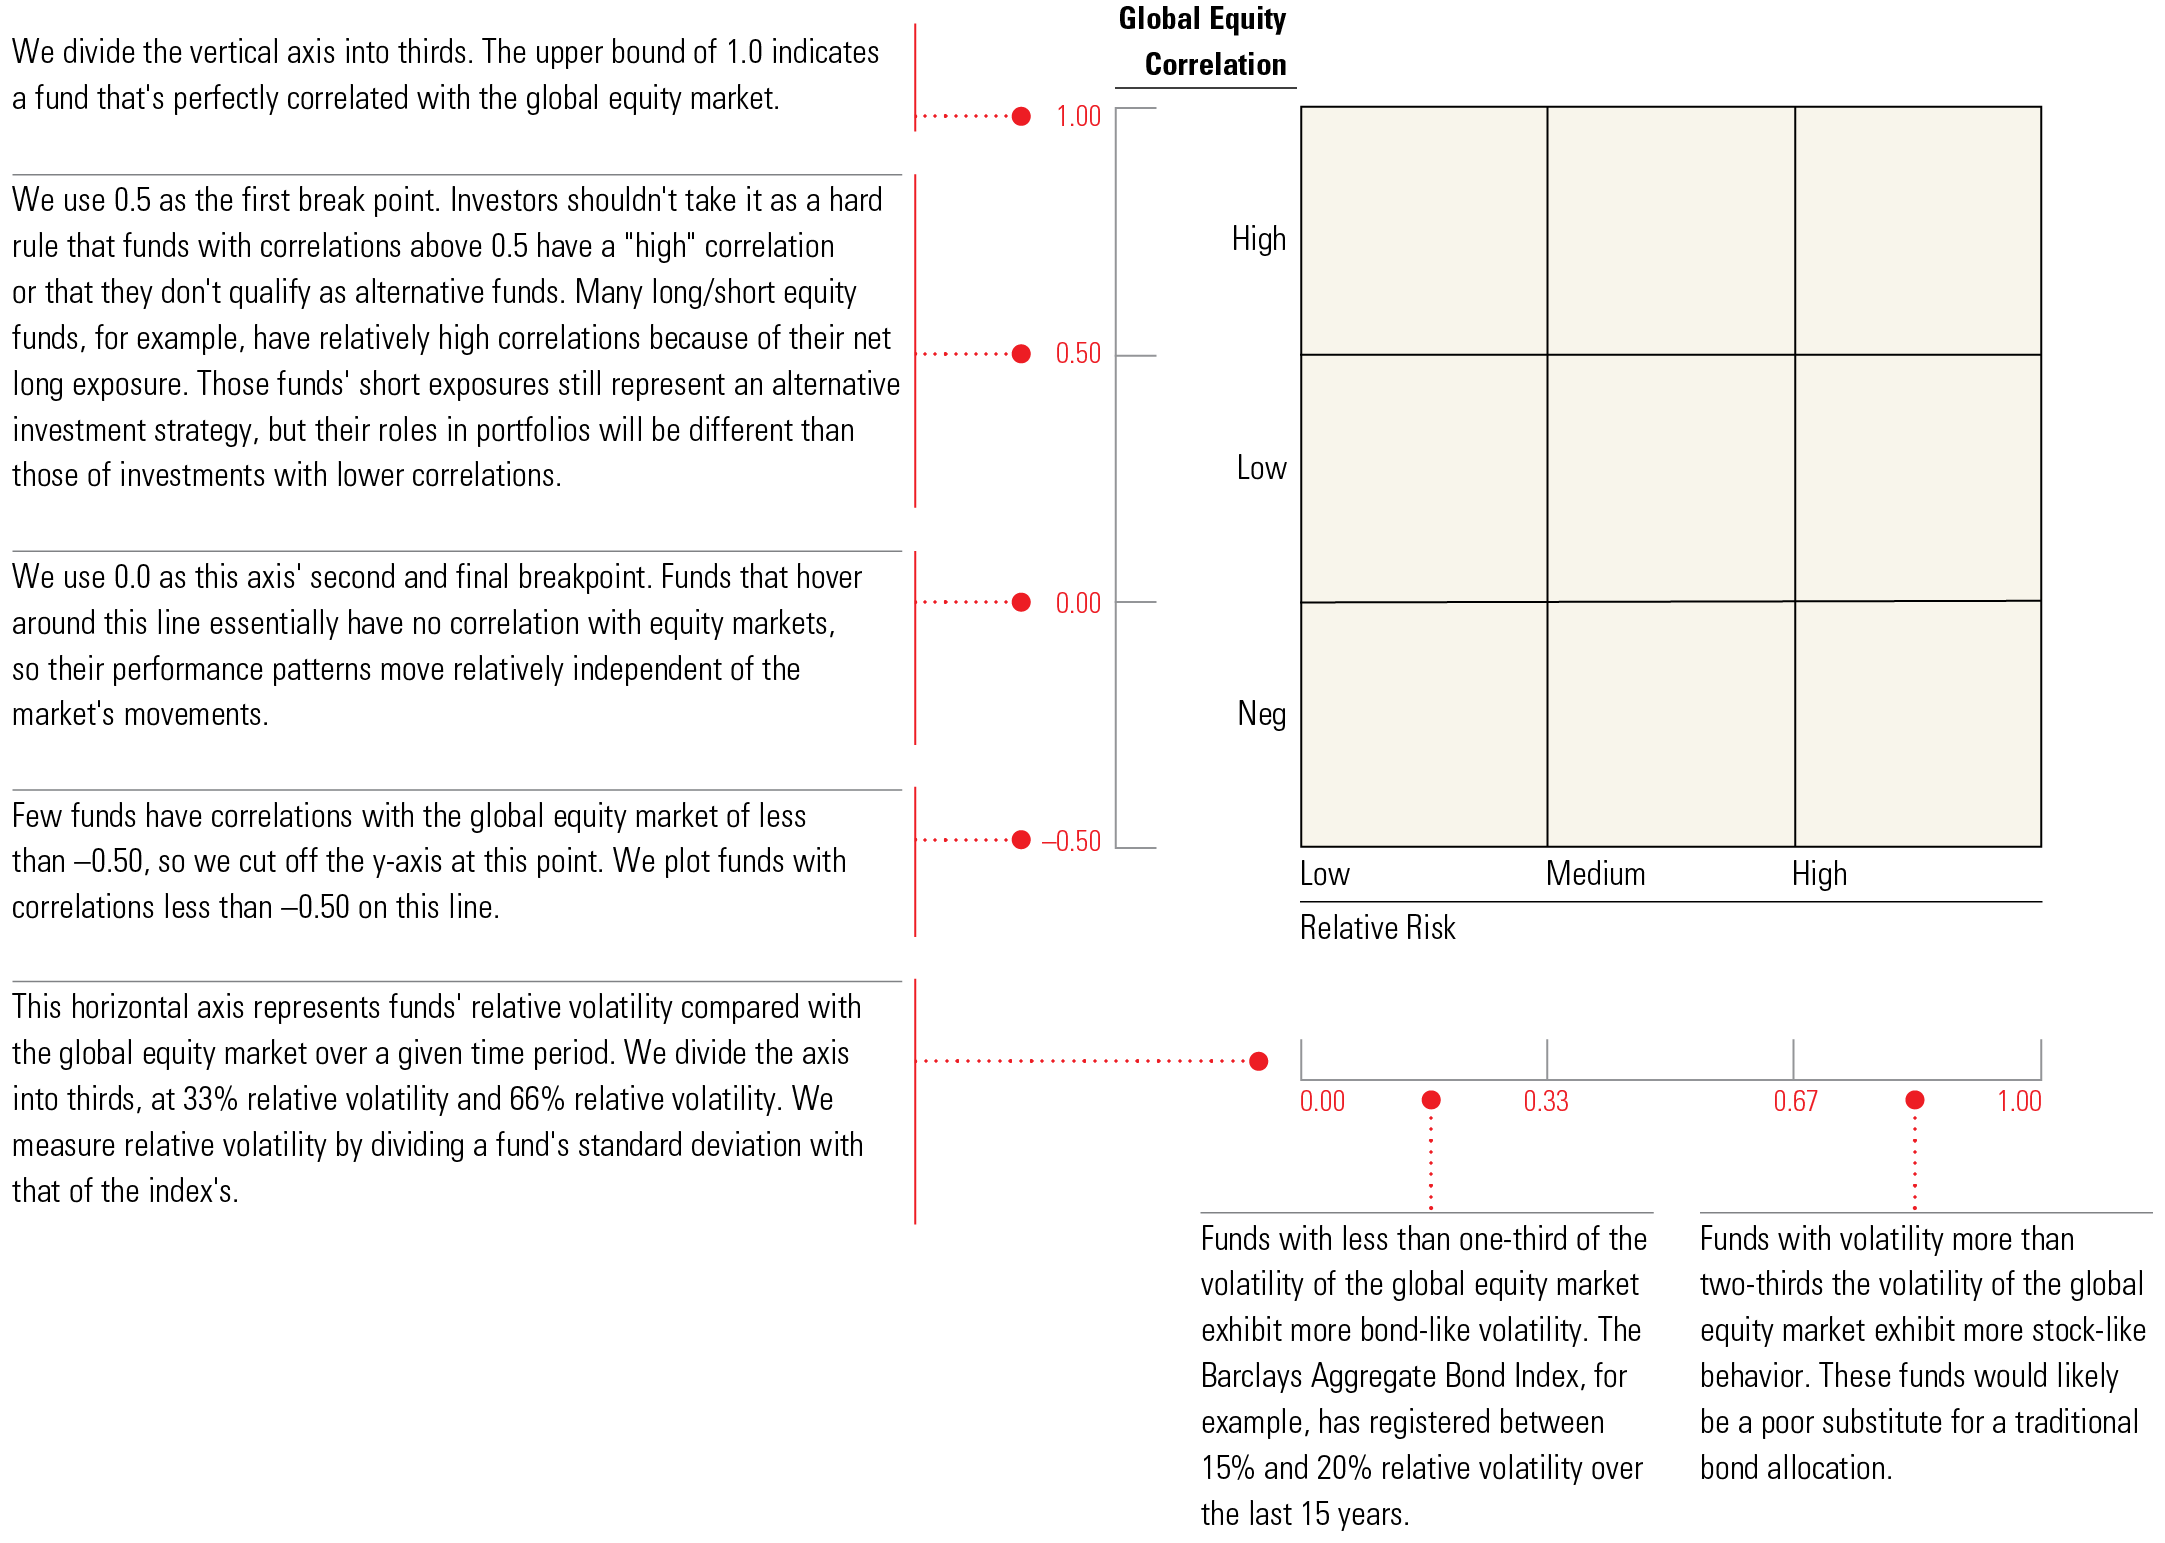
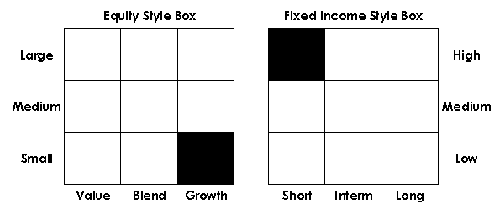
Style Boxes map financial products on a two axes diagram, but instead of using continuous values for the axes, they use discrete values (small/medium/large, value/blend/growth, etc.).
 (source)
How is this useful? Why should $1 be able to shift a product between squares? What's wrong with using for example the actual (normalized?) market cap on one axis and the actual (normalized?) P/E ratio on the other axis, in the familiar Cartesian representation?