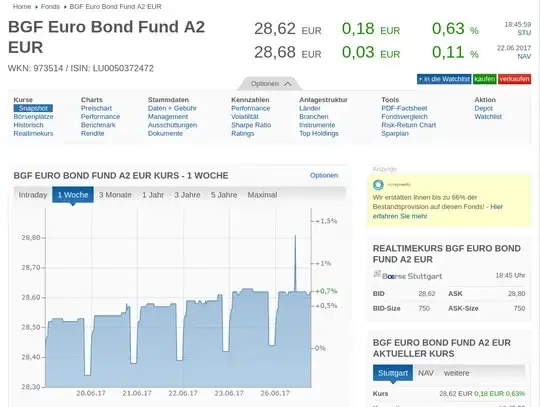
I'm curious why this bond (and likely many others) has a very regular pattern of vertical increases and decreases at what seems to me starts and ends of trading days. Visually it shows like a saw-tooth trend.
1 Answers
The example you provided is a BlackRock fund (or more precisely a SICAV) called BGF Euro Short Duration Bond Fund Class A2 EUR, not a bond.
A SICAV is a type of open-ended investment fund in which the amount of capital in the fund varies according to the number of investors. Shares in the fund are bought and sold based on the fund's current net asset value. SICAV funds are some of the most common investment vehicles in Europe.
Per the factsheet:
FUND OVERVIEW
The Fund aims to maximise the return on your investment through a combination of capital growth and income on the Fund’s assets. The Fund invests at least 80% of its total assets in fixed income (FI) securities. The FI securities may be issued by governments and government agencies of, and companies and supranationals domiciled in countries inside or outside of the Eurozone.
The pattern is probably due to the fact that its NAV and price/share are only calculated once a day, after the market closes.
- 9,353
- 2
- 23
- 31
