33

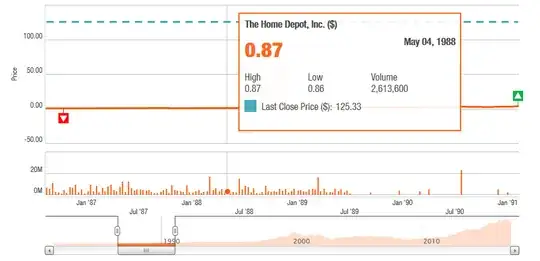
I was exploring various stocks this morning on Google Finance, and I came across some strange behavior for Home Depot (HD) in 1988. For the entire year, the stock traded incredibly low, and at incredibly high volume. I've seen large spikes in volume before, but never so consistent over an entire year. Is this a Google Finance bug? If not, does anyone know what caused this?

Here's a link to Home Depot on Google Finance.

Home Depot's Stock

jpmc26
  • 103
  • 1
  • 6

2 Answers2

39

It's got to be a bad chunk of data on Google. Yahoo finance does not show that anomaly for 1988, nor does the chart from Home Depot's investor relations site:

HD historical data 1988 from homedepot.com

Ben Miller
  • 116,785
  • 31
  • 330
  • 429
-3

So a major problem with looking at historical stock data on these graphs is that they set the stock price based off of current market volumn.

If I was to say look at Majesco Entertainment (COOL) in june of 2016. It would say that the stock as trading between $5-6. In reality it was between .50-$1. But in august there was a 6:1 reverse split. So June's value based on todays current share count would be about $5-6 per one share.

1988 for home depot must have been a really bad year for them, and because of all the splits they've had over the years already screws that estimate of what one share is worth. There's a lot of variance in 1988, but you have to be looking at only 1988. 87 and 89 really screws the the chart's scale.