10

I've noticed that stocks/ETFs that measure volatility (TVIX, VXX, UVXY, XVZ) are all trending down massively (eg VXX going from $7000/share on 3/09 and on 6/16 it is around $16/share) in the long-term even after accounting for stock splits. Why is that? This does not correlate with the VIX according to the charts. Is it possible to explain this in layman's terms or with examples please? I'm an amateur stock trader and am trying to understand the mechanics of this. Thanks!

TVIX: TVIX

UVXY: UVXY

VXX: VXX

XVZ: XVZ

Now look at the VIX: VIX

Bob Baerker
  • 77,328
  • 15
  • 101
  • 175
perseverance
  • 103
  • 1
  • 1
  • 7

3 Answers3

11

In an attempt to express this complicated fact in lay terms I shall focus exclusively on the most influential factor effecting the seemingly bizarre outcome you have noted, where the price chart of VIX ETFs indicates upwards of a 99% decrease since inception.

  1. The VIX index is a cash/spot index, but it is not tradeable as an index. The VIX only trades as futures contracts based on the underlying index.
  2. Futures contracts on the VIX index normally trade at a premium to the spot index value. This means that futures prices are normally higher than the spot price. (This situation is referred to as contango.)
  3. VIX ETFs such as VXX hold one-month and two-month futures as assets. As the near month expires, those positions are rolled over into the two-month forward contract and what was the two-month forward contract becomes the near-month future.
  4. Over a five year period this equates to 60 rollovers - one rollover each month.
  5. Combining points 1 to 4, we see that if a two month futures contract is typically trading at a 1.11% premium to the spot VIX, and assuming that this 1.11% premium is lost as the average value of the spot VIX index remains roughly constant (on average) - i.e., volatility averages out over time - then the compounded effects of this monthly rollover of futures across the 60 months comprising 5 years is equal to a 93% decrease in the price, where 1.011^60 is about 93%.

Other factors include transaction costs and management fees. Some VIX ETFs also provide leveraged returns, describing themselves as "two times VIX" or "three times VIX", etc.

Regarding the claim that volatility averages out over time, this is supported by your own chart of the spot VIX index.


EDIT It should be noted that (almost) nobody holds VIX ETFs for anything more than a day or two. This will miminise the effects described above. Typical daily volumes of VIX ETFs are in excess of 100% of shares outstanding. In very volatile markets, daily volumes will often exceed 400% of shares outstanding indicating an overwhelming amount of day trading.

not-nick
  • 6,417
  • 1
  • 19
  • 31
0

There is more than a single reason why TVIX loses value over time.

  • Futures curve. VIX is always expected to trend up when under 20(although this could change in the future). This means 1 month away futures contracts are bought at a premium closer to 20. If the .VIX stayed flat at 15, by the end of the month, that contract is only worth about 15. meaning you lost 25%. This affects all VIX ETFs and makes inverse VIX ETFs attractive to hold(if you don't mind your account blowing up periodically).

  • Leverage decay. if VIX goes down 25% two consecutive days, your x2 ETF(TVIX, UVXY) goes down 75%. Even if it doubled back to yesterday's value next day, you'd still be 25% down.

  • ETF funding costs. The fund managers take some money from the pot every day.

-2

Since these indices only try to follow VIX and don't have the underlying constituents (as the constituents don't really exist in most meaningful senses) they will always deviate from the exact numbers but should follow the general pattern. You're right, however, in stating that the graphs that you have presented are substantially different and look like the indices other than VIX are always decreasing. The problem with this analysis is that the basis of your graphs is different; they all start at different dates...

We can fix this by putting them all on the same graph: Combined VIV, TVIX, UVXY, VXX & XVZ graph 2011-2016 this shows that the funds did broadly follow VIX over the period (5 years) and this also encompasses a time when some of the funds started. The funds do decline faster than VIX from the beginning of 2012 onward and I had a theory for why so I grabbed a graph for that period. My theory was that, since volatility had fallen massively after the throes of the financial crisis there was less money to be made from betting on (investing in?) volatility and so the assets invested in the funds had fallen making them smaller in comparison to their 2011-2012 basis.

Combined VIV, TVIX, UVXY, VXX & XVZ graph 2014-2016

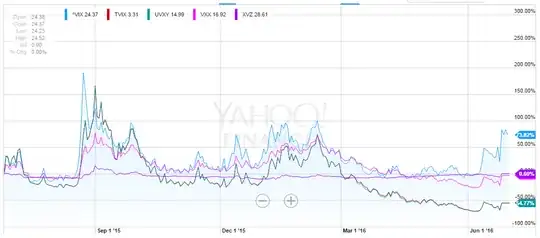
Here we see that the funds are again closely following VIX until the beginning of 2016 where they again diverged lower as volatility fell, probably again as a result of withdrawals of capital as VIX returns fell. A tighter graph may show this again as the gap seems to be narrowing as people look to bet on volatility due to recent events.

So... if the funds are basically following VIX, why has VIX been falling consistently over this time? Increased certainty in the markets and a return to growth (or at least lower negative growth) in most economies, particularly western economies where the majority of market investment occurs, and a reduction in the risk of European countries defaulting, particularly Portugal, Ireland, Greece, and Spain; the "PIGS" countries has resulted in lower volatility and a return to normal(ish) market conditions.

In summary the funds are basically following VIX but their values are based on their underlying capital. This underlying capital has been falling as returns on volatility have been falling resulting in their diverging from VIX whilst broadly following it on the new basis.

MD-Tech
  • 9,156
  • 2
  • 34
  • 42