Using Fundamental and Technical Analysis together is actually a good idea for longer term trading of up to 6 months or longer.
The whole idea behind trading with Technical Analysis is to increase the probabilities of a trade going in the desired direction by using uncorrelated indicators that produce the same signal to buy or sell at the same time.
For example, you might use a Moving Average (MA) as a buy signal when the price falls for a few days, hits the MA and then reverses and starts moving back up. If however, you also include a Stochastic Oscillator (SO) to indicate when the stock is oversold (under 20%), and if the price rebounds from the MA average at the same time as the Stochastic is crossing over in the oversold position, then this may be a higher probability trade. If you also only trade stocks that are Fundamentally healthy (as fundamentally good stocks are more likely to go up than fundamentally bad stocks) then this might increase the probabilities again. Then if you only buy when the market as a whole is moving up, then this will increase your chances again.
A few weeks ago at a seminar, the presenter totalled the men in the room to be 76 and the women in the room to be 8. He then asked what will most likely be the next person to walk in the room - a man or a woman? The statistics are on the side of a wan walking in next. This is what we try to do with Technical Analysis, increase our chances when we take a trade. Of course a woman could be the next person to walk in the room, just like any trade can go against you, and this is why we use money management and risk management and take a small loss when a trade does go against you.
Lets look at an example where you could incorporate FA with TA to increase your chances of profits:

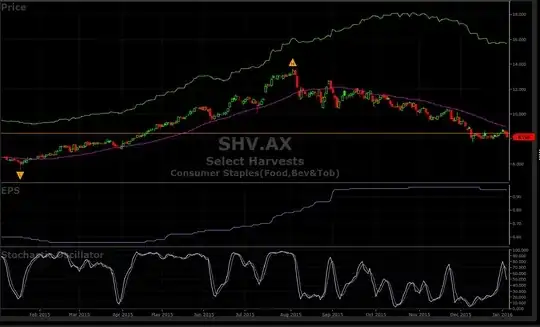
Above is a candlestick chart of Select Harvest (SHV), the green line above the price is the perceived value, the pink line is the 40 day MA, the blue line is the EPS, and the white lines is the Stochastic Oscillator (above 80% being overbought and below 20% is oversold).
From Feb 2015 to start of Aug 2015 the stock was uptrending, since then the price reversed and started to downtrend. The stock was determined to be fundamentally good early in 2015 with the perceived value gradually increasing and greater than the share price, and the EPS starting to increase regularly from mid April. Thus, as the stock is seen as fundamentally healthy any price reversal in the vicinity of the MA could be seen as a buy opportunity. In fact there where 2 such opportunities on 31st March and 11th June where price had reversed and rebounded off the MA whist the SO crossed over in or near the oversold area. The price did reverse and then rebounded off the MA again on 9th July, however the SO was not in or near the oversold area on this occasion, so not as high in probability terms. The price still rebounded and went up again, however another momentum indicator (not shown here) shows some bearish divergence in this case - so another reason to possibly keep away at this point in time.
A good signal to get out of the trade, that is your stop loss has not already taken you out, is when the price breaks and closes below the MA line. This occurred on 7th August. So if we had bought on the first signal on 31st March for $7.41 and sold when the priced broke through the MA on 7th August for $11.76, we would have made a profit of approx. 59% in just over 4 months. If bought on the second signal on 11th June for $9.98 and again sold on 7th August for $11.76, we would have made about 18% in under 2 months.
So the fundamentals, the Price (in relation to MA) and the SO where all lining up to provide two high probability trades. Of course you would need to incorporate you risk management (including stops) in case the price did not continue upwards after you bought. If the market is also moving up on the day of the signal this will further increase your chances.
Unless you day trade, which I would avoid, a good way to enter your trades after a signal is to enter a stop buy order after market close to buy if the price moves above the high of the signal day. That way if the market and the stock open and move lower during the day after the signal you avoid entering the trade altogether. This can be incorporated as part of your risk management and trading rules.
After the price broke down through the MA we can see that a downtrend commenced which is still current today (in fact I just took a short trade on this stock yesterday). We can also see that the perceived value, whilst still above the price, has reached a peak and is currently moving downwards and the EPS after being flat for a few months has just moved down for the first time in 10 months. So maybe the fundamentals are starting to waver a bit on this stock. It may be a good stock to continue shorting into the future.
So basically you can continue using Fundamental Analysis to select which stocks to buy, place them in a watch-list, and then use Technical Analysis to determine when these stocks are starting to uptrend and use a combination of uncorrelated indicators to produce higher probability signals for when to enter your trades.
