Answer: something else (it's complicated!)
After-hours and pre-hours trading is not subject to any price barriers or halts, and is mostly unregulated accordingly. Trading errors/spikes are a significant trap for the unprepared, especially when there are corporate actions involved such a dividends, spinoffs, splits etc.
Different sources will include/exclude certain trade conditions and/or exchanges/trading venues. For regular market-hours trading, the rules are well-defined by the Consolidated Tape Association and the UTP Plan.
For after-hours and pre-hours trading, there are no rules regarding trades. Some sources will report all trades. Some sources will only report a subset of trades.
In the case of NVDA on trade date Jul 22 2021, there were no corporate actions involved (there was a 4:1 stock split a couple of days earlier, but this is unrelated).
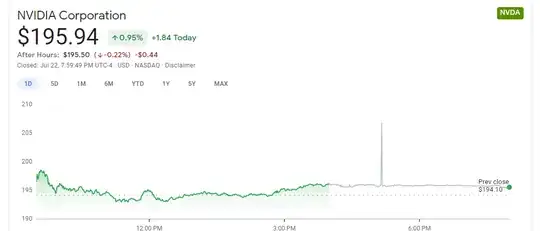
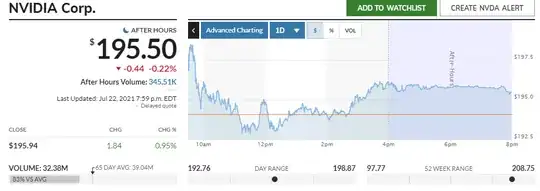
Your attachment shows that NVDA closed at $195.94 but spike in after-hours trading above $205 according to one source and not to another.
Looking at high-cost instutional-level data feeds shows that NVDA had a single trade for $206.815 at 17:09:38 for 240 shares, performed through a dark pool.
The 15 most prior traders were from 17:08:45 through 17:09:10 at prices ranging from 195.65 thorugh 195.85 with volumes ranging from 1 share through to 128 shares from dark pools and NYSE Arca.
The 15 most subssequent traders were from 17:10:00 through 17:10:57 at prices ranging from 195.75 thorugh 195.85 with volumes ranging from 1 share through to 100 shares from dark pools and NYSE Arca.
The trade conditions present on the "spike" trade of 206.815 from a Dark Pool were:
Form T (i.e. afterhours, which all the other trades had too), and "Average Price" which is meaningless on dark-pool-reported trades.
Did the trade occur? Yes. Was it cancelled? No. Is it generally indicative of the price of NVDA? No.
Draw your own conclusions from this example of after-hours trading. For what it's worth, published data from exchanges/consolidate tape do NOT incorporate any pre- or after-hourse trading into daily pricing (OHLC) data.

