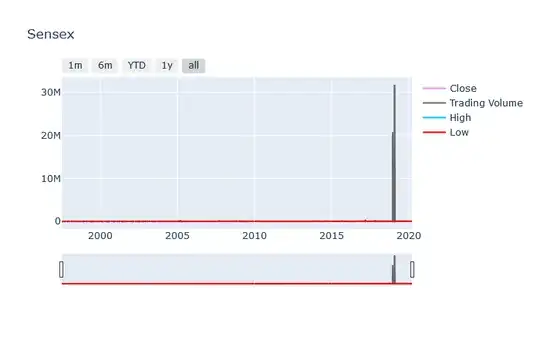
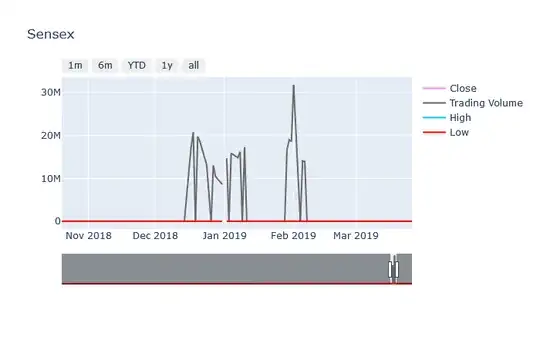
I won't pretent to be an economic genius because I'm not. I'm trying to plot some data in a graphical format for a friend of mine and while working on the project I noticed something strange. From 17th of December 2018 to 6th of February 2019, there were massive spikes in the trading volume of Sensex, the likes of which were and to this date have never been seen. At its peak (on 1st of Feb, 2019), the trading volume is registered 31.8 Million.
From what I understand according to my limited knowledge of economics (and a few hits on Google :P), the volume represents the number of transactions during a trade the number of shares traded. (Thanks Bob, for correcting me in the comment)
I googled the incident and surprisingly nothing turned up. I was wondering if someone can explain what happened back then. Or maybe it's only a glitch in the data. The data is downloaded from Yahoo Finance.
