U.S. Treasury pricing is done via auction at time of issuance and traded like any other financial instrument (i.e. stocks/bonds) where the price/value is agreed upon by the seller and buyer.
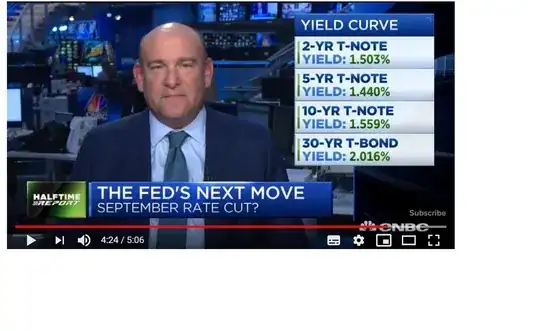
U.S. Treasuries are broken up into maturities like: 1 month, 3 month, 6 month, 1 year, 5 year, etc. and that creates the yield curve. See What is the yield curve? for details.
To be clear, the Yield Curve is just the collection of current expectation of yield of a given maturity.
Trading US treasury bills and notes needs to take into account when was the original issue and what is the current yield curve. For example on 08/13/19, a 1 Year Treasury bill's yield was 1.86 percent, but earlier in the year the 1 year bill had a higher rate so if I bought a 1 year bill in January and wanted to sell it, the price/value of bill would adjusted to a matching maturity since there is less than half a year on the 1 year bill left along with an appropriate yield.
Bloomberg itself may show the full yield curve or just a few important Treasury note yield values like the 10 year which affect mortgage rates. See: Why do 10 year Treasury bond yields affect mortgage interest rates?
Follow up from OP:
"To be clear, the Yield Curve is just the collection of current expectation of yield of a given maturity.". How are these expectations i.e the exact yield established?
Realize that as you go longer (further in time) with maturity, less is known about the global/US economy so more opportunity/inflation risk is taken and therefore in general a higher yield is expected to given to lock up that money for that period, even if its the 'risk-free' U.S. Government kind.
As mentioned by others, as there is secondary market for U.S. Treasury Bills/Notes/Bonds where the yields vary based on expectations. If you've read both the links I've referenced can you quote those for any confusion you may have as each maturity has their own circumstances.
Do realize that the current flatting to inversion of the yield curve just means that market is pricing in 'volatility' of events in the "near term" where "near term" is around 1-2 years. As a leading indicator with a track record, the yield curve a simple one upon which to build a narrative for.
