Plotting in MATLAB is typically not done symbolically. You need to do it the way you learned how to graph things in grade school: by evaluating the function at a few places and then connecting the dots.
Fortunately, you don't need to do the math by hand. Here's a basic example:
$$ y = x^2 + 4$$
- Evaluate the function at a few places: let's choose x = -2, -1, 0, 1, 2.
| x |
y |
| -2 |
8 |
| -1 |
5 |
| 0 |
4 |
| 1 |
5 |
| 2 |
8 |
- Connect the dots.
Let's see some code that does this.
x = [-2:2];
y = x.^2+4;
plot(x,y);
Output:
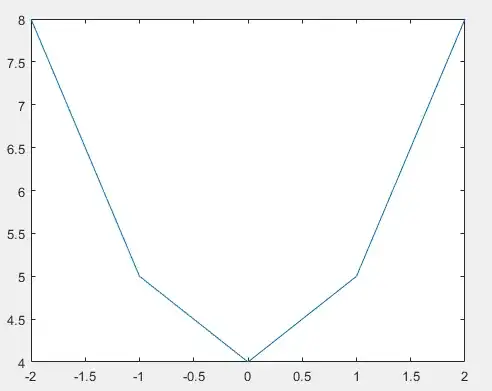
You can see that MATLAB just draws lines between the data points, so if you want more resolution, you need more samples. For your equation, you can do the following:
w = logspace(0,8,1000);    % Creates a vector of 1000 points spaced logarithmically
Y = 1./sqrt(R^2+w.^2*L^2); % Calculates Y at every value of w.
semilogx(w,Y);             % Plots Y as a function of w on a log scale.
