I'm interested in generating a chart / diagram of power usage for a system, as well as some sort of tree digram of voltage rails.
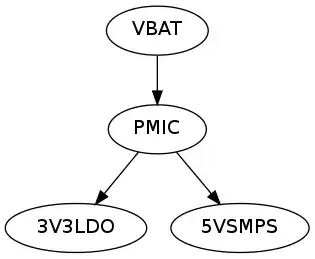
For example, you might have a PMIC connected to VBAT, the output of which is connected to a 3V3 LDO, 5V SMPS, etc etc.
Keeping track of all the rails, and where they connect to would be very handy.
Additionally, being able to assign powers to each rail would aid in visualizing where the power is going.
Any thoughts on how to create something like this easily?
Ideally, I'd like a tool that could generate a chart automatically -- I don't want to create a tree diagram manually with 50 boxes if I can do it programatically.
Thanks!
EDIT: looks like there is an excel plugin. Awesome++
– hex4def6 Jan 11 '13 at 00:51