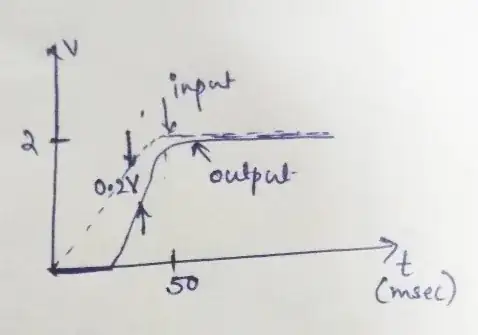
I need help to find the transfer function of the system from this input/output graph:

-
From long ago 10~90% T = 0.35/f(-3dB) Compare both then determine gain and offset – Tony Stewart EE75 Jun 20 '20 at 19:56
-
@ Tony Stewart Sunnyskyguy EE75 : Tried solving this ...If TF=K/s+a form, then a=1/T=20 and finding value of K by steady state error formula for step response we get K=a=20.So, TF=20/S+20..Is this correct ? – anie Jun 20 '20 at 22:11
-
your photo needs cropping, and optimally a bit of rotation, and better lighting; here's some advice on taking better photos of drawings (ignore the part specific to schematics – Marcus Müller Jun 20 '20 at 23:42
-
1@anie Note that you have a time delay. Looks to me like about $25:\text{ms}$. This tells you something about the transfer equation's numerator. Do you remember what? – jonk Jun 21 '20 at 01:50
-
Where did these waveforms come from? – Bruce Abbott Jun 21 '20 at 06:24
-
This is a problem which I came across...The only thing that was specified is that this is a input/output graph of a linear measurement device and need to find out the transfer function. – anie Jun 21 '20 at 14:57
-
Do you understand my answer? Or have any questions? – Tony Stewart EE75 Jun 21 '20 at 15:47
-
@anie The $25:\text{ms}$ delay implies that the factor, $e^{{-25,\text{ms}\cdot s}}$, will be included in the transfer function's numerator. – jonk Jun 23 '20 at 16:26
1 Answers
Since the input is not a Heaviside Step function, we cannot presume this is a frequency-domain problem but rather a non-linear function of gain and offset.
Not knowing where this sketch comes from, let me assume it a quasi-linear so that the gain exists above some threshold and is saturated or null gain elsewhere. Consider tolerances as loose as the sketch for now.
Examine the Vout vs Vin and Avg to obtain gain and offset.
Using coarse estimates
t (ms) 0 to 25 to 50 +   Linear Mean
in     0 to  1  to 2      1.5
out    0 to  0  to 2      1
gain   0 to  0==2==0
offset = out-in         -0.5
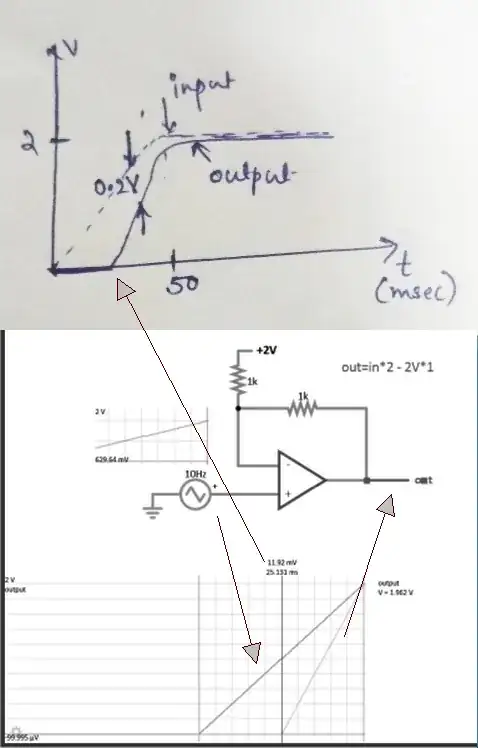
gain=2   (for in = 1 to 2, otherwise =0)
offset = -0.5*2=-1
out = 2(in-1)=in2-2  (for in = 1 to 2)
(rev B)
When amplifiers saturate, the linear gain =0 in this case for in<1 and in>2. But in the linear out range, the gain ~ 2.
The soft edges mean there is a compressed range where the gain changes from 0 to 2 to 0.
In this plot, there is no observable filter except on the previous input signals.
- 1
- 3
- 54
- 185
