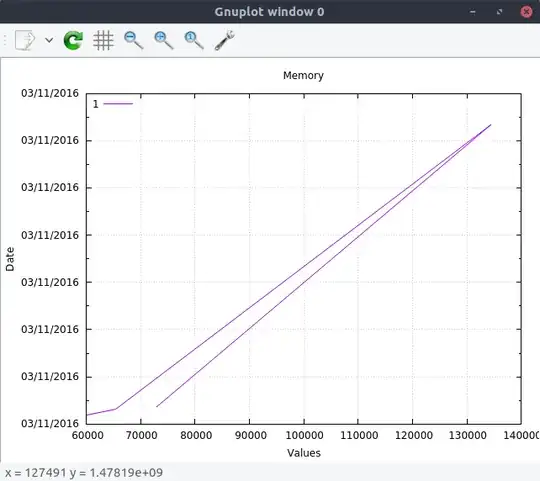
I have the following snippet to have a graph output via gnuplot.
set datafile separator ","

set title "Memory"
set xlabel "Values"
set ylabel "Date"
set ydata time
set timefmt "%H"
set format y "%d/%m/%Y"
set key left top
set grid

plot 'memory-memory-buffered_combined' using 0:2 titl "1" with lines,\
     'memory-memory-cached_combined' using 0:2 title "2" with lines
cat
pause -1
However, when I have the result it starts from 1970.
The first 5 lines of the csv I am reading;
epoch,value
1478193413.596,72910
1478193473.412,134432
1478193413.158,65449
1478193411.929,60157
So, it is actually November 2016.
Which part of my script should be different?
