4

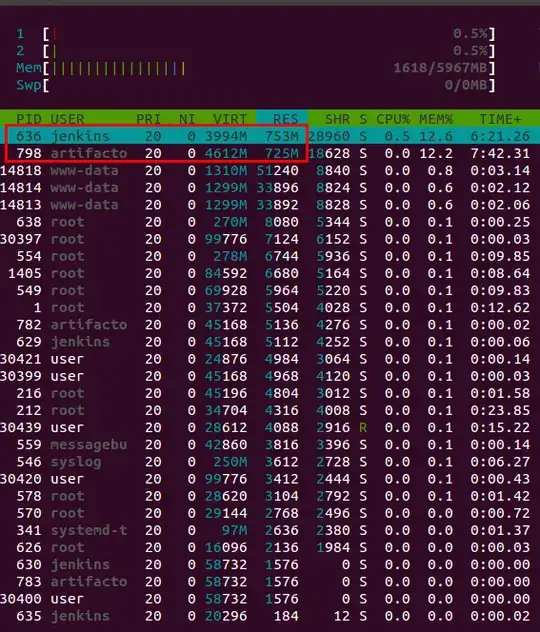
I am trying to make sense out of htop. I have a virtual PC with 6 GB RAM running ubuntu 15.10. I have installed a few applications on the server: Jenkins, Artifactory and some other tools. When I run htop I get this:

enter image description here

When I look at the VIRT and RES column the numbers far exceed the overview in the top showing that 1615/5967 MB is currently consumed.

How do I get a real view of how much RAM the the different applications on the server consumes?

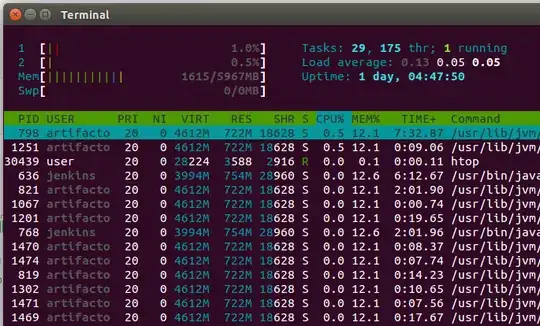
By default Hide kernel threads are selected:

enter image description here

I have tried to enable Hide userland threads and the list now makes more sense:

enter image description here

Duplicates are still shown but at least only the "expected" memory consumption are shown for one instance of the applications. Not sure if its recommended to have this setting enabled though.
u123
  • 3,062
  • 7
  • 21
  • 28

2 Answers2

2

In simple terms, VIRT colmn is how much memory the process can use for that process. E.g. artifacto mapped it self 4612M to use.

RES- This represents how much memory it is currently using. For Artifacto is is currently using 722M.

Here is a link with some more info subject; HTOP reference

esefarm
  • 66
1

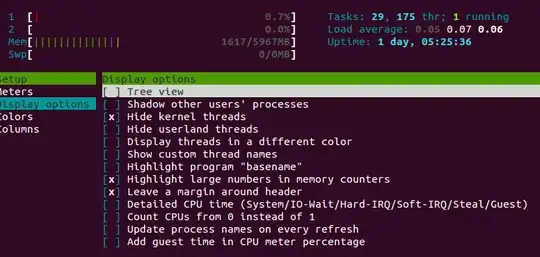
I believe htop defaults on how many threads the main process is using and will show all of them. You can edit this out in the htop config file. goto: ~/.config/htop/htoprc. or try in htop press F2 and goto display options and press space select "hide kernel threads" and "hid userland threads" Should trim it down for you.

esefarm
  • 66