5

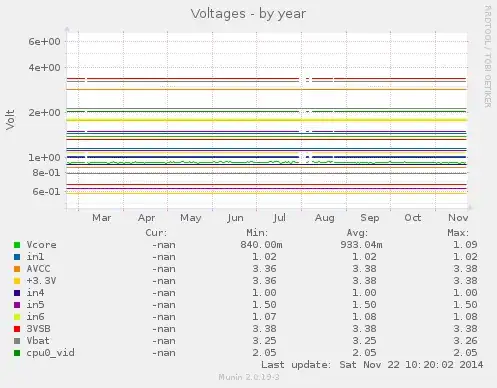
I've noticed that graphs with lots of values which have min/max warn limits look extremely crowded - all these min/max limits are drawn as lines via rrdtool HRULE. I haven't found a way to disable drawing of these warn lines.

I still need munin to check for these warn values (which makes graphs red, sends emails, e.t.c), but I don't want to see warn lines. I typically know where they should be.

Any suggestions how to disable drawing warn lines?

enter image description here

1 Answers1

5

I made plugin to monitor the room temperatures at home. I ran into same problem as you are and I've noticed that the graphs are only showing the warning lines.

Having only critical values, kinda “solved” the problem. I simply commented out the warning fields in my plugins code:

echo "budapest.label Budapest\n";
echo "budapest.info Budapest\n";
echo "budapest.colour COLOUR7\n";
//echo "budapest.warning -15:38\n";
echo "budapest.critical -18:40\n";

Warning lines on the graph

Graph with only critical values

If one of the values are outside of critical ranges, the graph will show up with red border as usual.

I don't know if it's bug or feature.

Update: I spoke with the munin folks on the official IRC channel and they suggested to report this as bug and try fix munin itself.