I'm looking for easy software which can create 3d plot with polar coordinates (cylindrical coordinates) from a csv file (or pasted from eg. libre office). Making a trend-surface or sth like it would be useful too. I want also to have only 90 degree view.
Asked
Active
Viewed 1,450 times
1 Answers
1
Part of the answer depend which kind of interface you want and the kind of output you require (quality, details, etc).
If you are OK with a command line interface, the "classical" package for doing that is gnuplot, as stated in the comments. This is what I normally use for the first shot. I however think that PyXplot will normally give much nicer plots (but it is a bit more difficult to grok, and to really use it you have to know LaTeX).
For an example of use of spherical/cylindrical coordinates in gnuplot, see for example this page: http://www.gnuplot.info/demo/world.html --- the trick here is the set mapping command. You could need to do some transformation on your input file, however. This article by Lee Phillips seems interesting, too.
gnuplot> help set mapping
 If data are provided to `splot` in spherical or cylindrical coordinates,
 the `set mapping` command should be used to instruct `gnuplot` how to
 interpret them.

 Syntax:
       set mapping {cartesian | spherical | cylindrical}

 A cartesian coordinate system is used by default.

 For a spherical coordinate system, the data occupy two or three columns
 (or `using` entries).  The first two are interpreted as the azimuthal
 and polar angles theta and phi (or "longitude" and "latitude"), in the
 units specified by `set angles`.  The radius r is taken from the third
 column if there is one, or is set to unity if there is no third column.
 The mapping is:

       x = r * cos(theta) * cos(phi)
       y = r * sin(theta) * cos(phi)
       z = r * sin(phi)

 Note that this is a "geographic" spherical system, rather than a "polar"
 one (that is, phi is measured from the equator, rather than the pole).
Press return for more:

 For a cylindrical coordinate system, the data again occupy two or three
 columns.  The first two are interpreted as theta (in the units specified by
 `set angles`) and z.  The radius is either taken from the third column or set
 to unity, as in the spherical case.  The mapping is:

       x = r * cos(theta)
       y = r * sin(theta)
       z = z

 The effects of `mapping` can be duplicated with the `using` filter on the
 `splot` command, but `mapping` may be more convenient if many data files are
 to be processed.  However even if `mapping` is used, `using` may still be
 necessary if the data in the file are not in the required order.
If you are looking for more graphical things, this Wikipedia page can help you. In the end I found that command-line driven programs are better for this kind of things (hated Origin with all my forces), but your mileage may vary.
QtiPlot, in particular, seems a nicely done program; it is open-source and free on Linux (you can install it simply with apt-get install qtiplot):
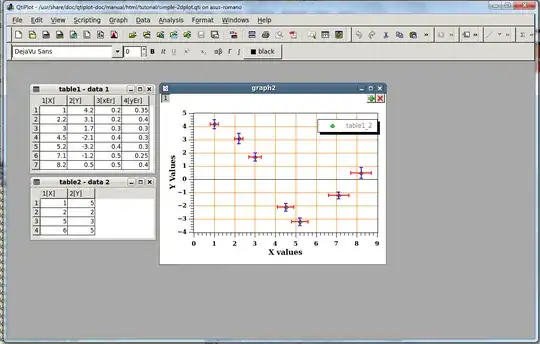
but I never used it in extended way so I can't help with it a lot. ...But if you really like it remember that it is donation-ware(1) :-)
(1) I am NOT related at all to this project or the developers. I simply checked it and find it quite well done and well maintained.
Rmano
- 32,167