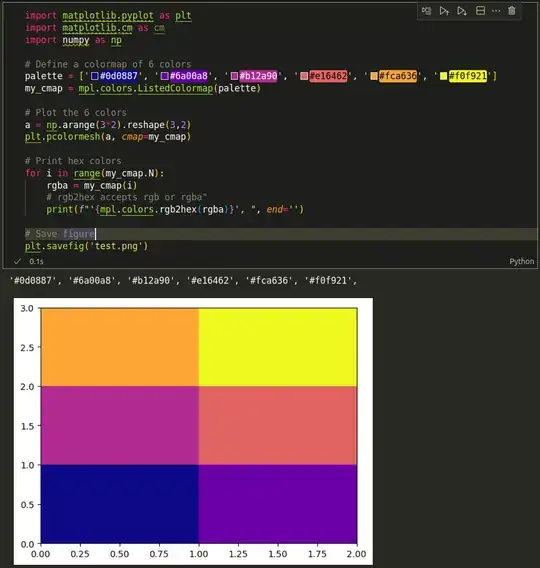
Here is a Python code that creates a plot with 6 defined colors and saves it in a PNG file:
import matplotlib as mpl
import matplotlib.pyplot as plt
import matplotlib.cm as cm
import numpy as np
Define a colormap of 6 colors
palette = ['#0d0887', '#6a00a8', '#b12a90', '#e16462', '#fca636', '#f0f921']
my_cmap = mpl.colors.ListedColormap(palette)
Plot the 6 colors
a = np.arange(3*2).reshape(3,2)
plt.pcolormesh(a, cmap=my_cmap)
Print hex colors
for i in range(my_cmap.N):
    rgba = my_cmap(i)
    # rgb2hex accepts rgb or rgba"
    print(f"'{mpl.colors.rgb2hex(rgba)}', ", end='')
Save figure
plt.savefig('test.png')
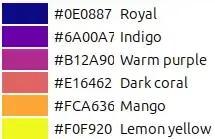
The plot created inside the Jupyter Notebook contains the correct colors, i.e. a color picker tool provides the same hex color values that are defined in the script.
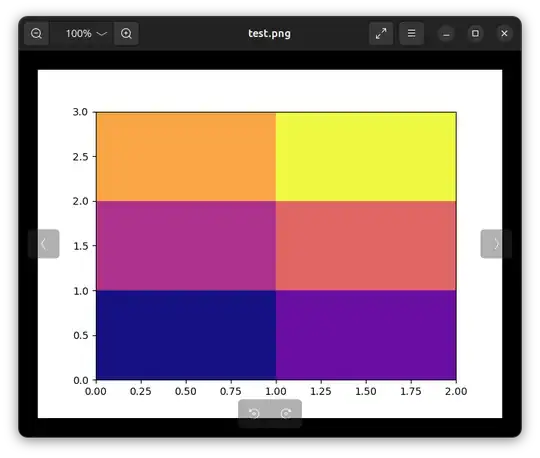
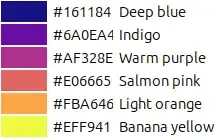
However, when opening the saved PNG file with Eye of GNOME Image Viewer or Firefox, the colors values obtained with the picker tool are different:
Colors are correct when opening the file with Shotwell, Loupe (default image viewer replacing Eye of GNOME), or Chrome.
System information:
- Ubuntu 24.04.1 LTS
- GNOME Shell 46.0


