Relevant info: Octave version...5.2.0
pkgs used: io-2.6.2
tablicious-0.3.5
Ubuntu version- 20.04.4 LTS
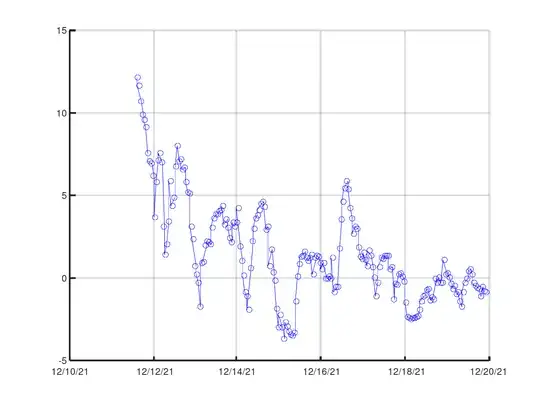
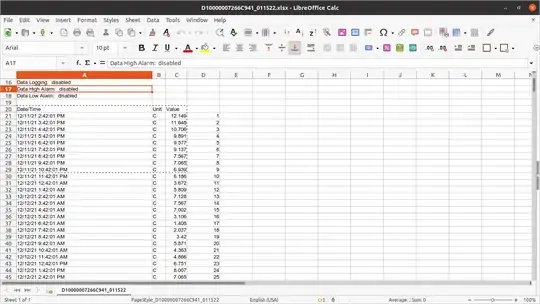
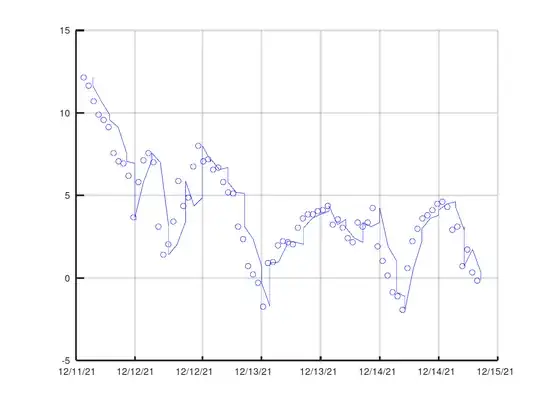
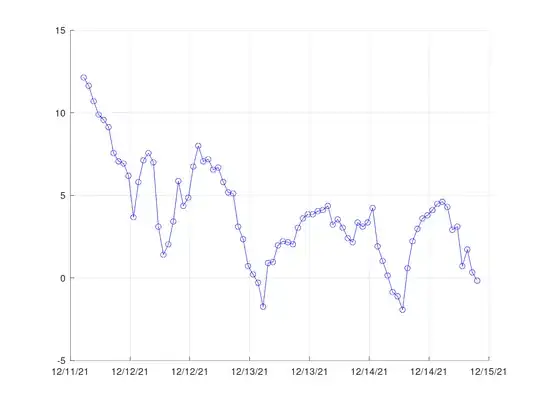
Hi! I'm reading timestamp and temperature data from an xlsx spreadsheet into Octave. I'm running into an interesting issue however. I'm able to plot the data, with the dateticks, and temperature data (markers) in the correct locations. Interestingly the (Line) seems to be close, but not actually connecting the markers. I'm not sure if I'm missing something silly, or experiencing a bug. Thanks so much! 

clear all;
clc;
pkg load tablicious;
pkg load io;
[a,b]=xlsread('D10000007266C941_011522.xlsx','D10000007266C941_011522','A21:A221'); temp=xlsread('D10000007266C941_011522.xlsx','D10000007266C941_011522','C21:C221');
% The code above successfully read dates into octave!
date=datenum([a,b],'mm/dd/yy HH:MM:SS PM');
timeformat='mm/dd/yy';
figure(1)
grid on;
hold on;
plot (date,temp, "linestyle",'-',"marker",'o',"color",'b');
datetick ('x',timeformat,'keeplimits');
set(gca, 'linewidth', 2)

