6

My laptop was working fine and its load average was between 0.2 - 0.5 (and around 0.02 while doing nothing) until I decide to upgrade it with an SSD.

First I replaced my HDD with SSD, moving HDD into a HDD Caddy, removing the optical drive and putting HDD there instead.

  • Both my SSD and HDD are capable of working with SATA III interfaces.
  • However my HDD is working at SATA 2 mode:

    sudo smartctl -a /dev/sdb | grep SATA
    SATA Version is:  SATA 3.0, 6.0 Gb/s (current: 3.0 Gb/s)
    
  • Seems my optical drive interface is SATA 2.

Problem

The problem is whenever there is something in HDD Caddy (SSD, HDD, Doesn't matter) load average while doing nothing is around 1.5 - 2 and while system is just booted up is around 4.

What did I done?

  • I have tried any combination of setup nothing takes any effects.

What else?

  • CPU usage is normal and no process is consuming the CPU.
  • If I only use one disk as the main hard drive load average is normal.
  • If I even use one disk at the optical drive place, I get high load average.
Ravexina
  • 57,256

2 Answers2

4

There is an excellent Q&A with the same problem:

enter image description here

The solution from top-voted answer was this command:

echo "disable" > /sys/firmware/acpi/interrupts/gpe6F

In the link grep was used to discover the interrupt causing grief:

grep . -r /sys/firmware/acpi/interrupts/

Load Average

If you look at your system load average for 1-5-15 minutes like this:

$ cat /proc/loadavg
0.50 0.76 0.91 2/1037 14366

It's reporting .5, .76 and .91. From Understanding Linux CPU Load - when should you be worried? it says:

  • The "Need to Look into it" Rule of Thumb: 0.70 If your load average is staying above > 0.70, it's time to investigate before things get worse.

Further in the article it will mention something like the load average for all your CPUs are added together but not divided by the number of CPUs to get an average of all CPUs. You have to do this manually so the true values are:

.063 - .095 - .113

because I have 8 CPUs.

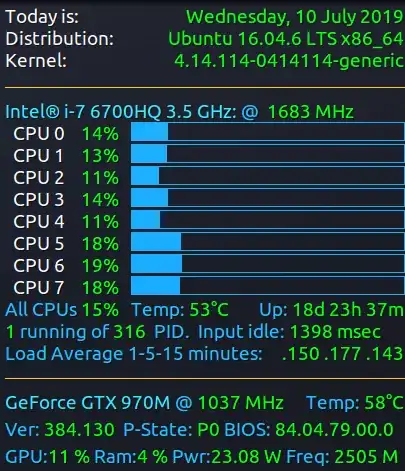
I prefer to use Conky to display this in real-time though:

conky nvidia.png

Notice the 4th line from the bottom display 1-5-15 minute load averages as:

.150 .177 .143

The 1 minute load average of .15 equates to 15% which matches the All CPU percentage value two lines above the Load Average.

Without diving by 8 I'd have a heart attack because I would be seeing:

1.200 1.416 1.144

Conky automatically divides for me with the Conky code:

${execpi .001 (awk '{printf "%s/", $1}' /proc/loadavg; grep -c processor /proc/cpuinfo;) | bc -l | cut -c1-4} ${execpi .001 (awk '{printf "%s/", $2}' /proc/loadavg; grep -c processor /proc/cpuinfo;) | bc -l | cut -c1-4} ${execpi .001 (awk '{printf "%s/", $3}' /proc/loadavg; grep -c processor /proc/cpuinfo;) | bc -l | cut -c1-4}

Of course not everyone uses conky probably only 1% of Linux users but for those out there that love Conky like me, you might find this code helpful.

4

This could be related to the HDD caddy you use.

Please see if it has a button or a switch, in order to change the state of the caddy.

this

Robert Riedl
  • 4,401