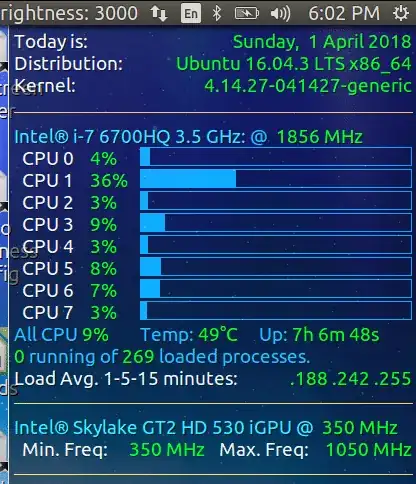
I have 16.04 LTS installed on a Ryzen 1700X computer. I am able to see the frequency of each of the individual 16 threads by running the command sudo cpupower monitor. Along with the frequencies, it displays information regarding power states, and what looks like the CPU base frequency.
This is an example of what is displayed:
|Mperf
CPU | C0   | Cx   | Freq
   0|  0.09| 99.91|  3493
   1|  0.04| 99.96|  3495
   2|  0.06| 99.94|  3498
   3|  0.06| 99.94|  3495
   4|  0.16| 99.84|  3439
   5|  0.05| 99.95|  3497
   6|  0.09| 99.91|  3494
   7|  0.10| 99.90|  3500
   8|  2.89| 97.11|  3474
   9|  0.13| 99.87|  3496
  10|  0.56| 99.44|  3485
  11|  0.07| 99.93|  3495
  12|  2.22| 97.78|  3474
  13|  0.19| 99.81|  3497
  14|  1.51| 98.49|  3490
  15|  0.01| 99.99|  3445
I have 2 requests. The first is how can I monitor these numbers in semi-real time; for a counter to show a frequency and update every 1 second? Is there a convenient feature in Bash which could repeat the command in a frequent manner?
The other concern is to strip the middle 2 columns or even better the first 3 and just leave the "Freq" column. This way I can easily input the data into Libreoffice Calc and compute averages and sums.
A possible alternative would be to setup psensor to be able to read the frequencies in real time. I am able to get psensor to display temperature and CPU usage via a modprobe command, however it does not show the fluctuation of frequencies (something I am interested in for overclocking and fine tuning purposes).
