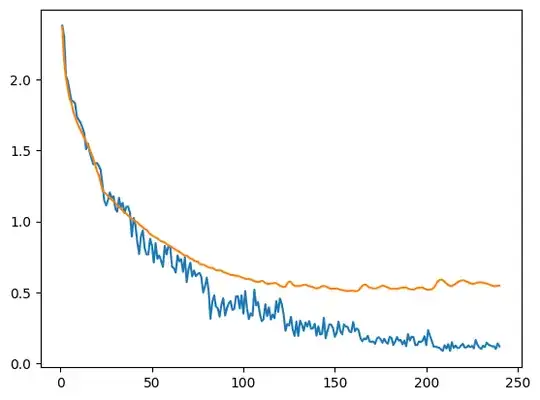
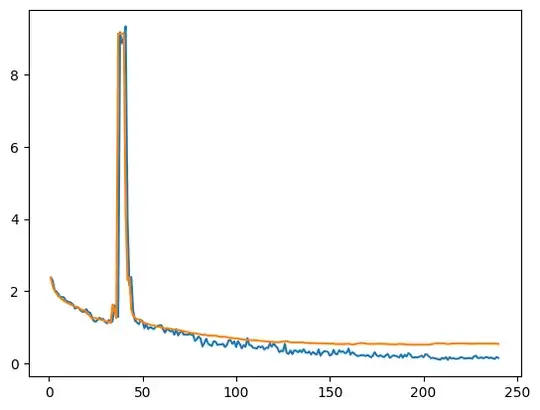
I fine-tuned mistral-7b for a text classification task, with LoRA adapter. When testing different hyperparameter combinations, I got these two loss curve charts:
Chart 1

Chart 2

Chart 1 and 2 use the exact same train and evaluation dataset, have the same hyperparameters except 'r' in LoRA. The 'r' in chart 1 (r1) is 16, and r2 is 8.
I have no idea why there is a big spike in chart 2. What could be the possible reason? Is it because of the warmup steps? I set the warmup_ratio to 0.3, so it's about the first 70ish steps I think.
I also tried another pair of hyperparameters, again, the 'r' is the only difference, and it shows the similar behaviour, a big spike when r=8 in the first 50 steps, but nothing special when r=16.
And, in this situation, is the second model (r=8) still usable? Because it has a better score in accuracy, recall, precision and f1.