22

BACKGROUND: The softmax function is the most common choice for an activation function for the last dense layer of a multiclass neural network classifier. The outputs of the softmax function have mathematical properties of probabilities and are--in practice--presumed to be (conditional) probabilities of the classes given the features:

  1. First, the softmax output for each class is between $0$ and $1$.
  2. Second, the outputs of all the classes sum to $1$.

PROBLEM: However, just because they have mathematical properties of probabilities does not automatically mean that the softmax outputs are in fact probabilities. In fact, there are other functions that also have these mathematical properties, which are also occasionally used as activation functions.

QUESTION: "Do softmax outputs represent probabilities in the usual sense?" In other words, do they really reflect chances or likelihoods? (I use likelihood in the colloquial sense here.)

Snehal Patel
  • 1,037
  • 1
  • 4
  • 27

3 Answers3

18

The answer is both yes, and no. Or, to put it another way, the answer depends on what exactly you mean by "represent probabilities", and there is a valid sense in which the answer is yes, and another valid sense in which the answer is no.

No, they don't represent the probability

No, they do not represent the true probability.

You can think of a neural network as a function $f$. Let $f(y;x)$ denote the softmax output of the neural network corresponding to class $y$, on input $x$. Then $f(y;x)$ will typically not be equal to $p(y|x)$, the probability that sample $x$ is from class $y$. $f(y;x)$ can be viewed as an estimate of $p(y|x)$ -- as a best-effort guess at $p(y|x)$ -- but it can be an arbitrarily bad estimate/guess. Neural networks routinely make errors on tasks that even humans find clear. Also, neural networks have systematic biases. For instance, as the other answer explains, neural networks tend to be biased towards "overconfidence".

So you should not assume that the output from the neural network represents the true probability $p(y|x)$. There is some underlying probability. We might not know how to compute it, but it exists. Neural networks are an attempt to estimate it, but it is a highly imperfect estimate.

Yes, they do represent probabilities

While the softmax outputs are not the true probability $p(y|x)$, they do represent a probability distribution. You can think of them as an estimate of $p(y|x)$. For a number of reasons, it is an imperfect and flawed estimate, but it is an estimate nonetheless. (Even bad or noisy estimates are still estimates.)

Moreover, the way we train neural networks is designed to try to make them a good estimate -- or as good as possible. We train a neural network to minimize the expected loss. The expected loss is defined as

$$L = \mathbb{E}_x[H(p(y|x),f(y;x))],$$

where the expectation is with respect to $x$ chosen according to the data distribution embodied in the training set, and $H$ is the cross-entropy of the distribution $f(y;x)$ relative to the distribution $p(y|x)$. Intuitively, the smaller the training loss is, the closer that $f(y;x)$ is to $p(y|x)$.

So, neural networks are trained in a way that tries to make its output be as good an approximation to $p(y|x)$ as is possible, given the limitations of neural networks and given the training data that is available. As highlighted above, this is highly imperfect. But $f(y;x)$ does still represent a probability distribution, that is our attempt to estimate the true probability distribution $p(y|x)$.

D.W.
  • 407
  • 4
  • 9
13

Excellent question.

The simple answer is no. Softmax actually produces uncalibrated probabilities. That is, they do not really represent the probability of a prediction being correct.

What usually happens is that softmax probabilities for the predicted class are closer to 100% in all cases, whether the predictions are correct or incorrect, which effectively does not give you any information. This is called overconfidence.

This means that the probabilities are not useful, and you cannot really use them as reliable confidences to detect when the model is unsure or predicts incorrectly.

For reference: Guo C, Pleiss G, Sun Y, Weinberger KQ. On calibration of modern neural networks. In International conference on machine learning 2017 Jul 17 (pp. 1321-1330). PMLR.

Snehal Patel
  • 1,037
  • 1
  • 4
  • 27
Dr. Snoopy
  • 1,363
  • 8
  • 12
1

Yes, but as the other answers said, the raw softmax output has the issue of overconfidence. So, you need a transformation to make them linear like logarithmic scale.

Logarithms have a unique relationship with infinity. As numbers approach infinity, logarithms grow, but they do so more slowly than the numbers themselves. This slow growth can be philosophically interpreted as a metaphor for how small actions or small steps can still have an infinite impact over time. The logarithm provides a bridge between the finite (real-world measurements like IEEE 754 representation) and the infinite (theoretical concepts), suggesting that even seemingly small, finite changes can have profound, infinite consequences.

To address the overconfidence issue, let $a$ be the maximum value of probability. Intuitively, putting them inside a logarithmic scale $ -\log_2(1 - a)$ would reduce the overconfidence issue as it's sensitive to the small difference when the $a$ close to $1$, therefore it can be used for confidence measurement.

Additionally, we can also consider the minimum value of probability to represent how assertive the softmax output's statement is as the support, and so that I can consider it as an uncertainty measurement.


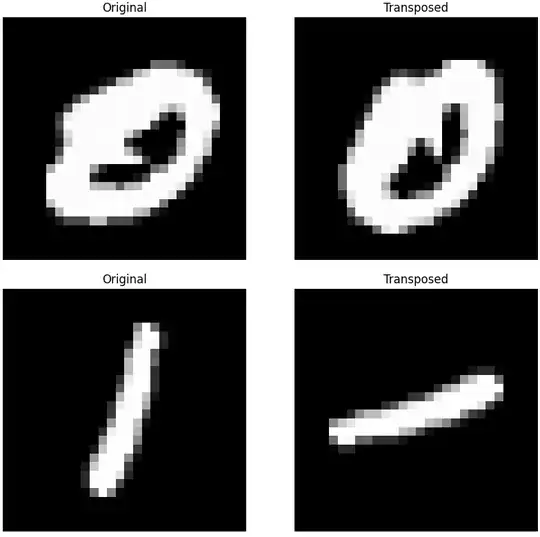
I tested it when I trained MNIST Handwritten Digit of 10 classes as usual. Where I use the original input and its 90-degree-rotated (transposed) input. Subjectively speaking, there is no such number that looks like a horizontal line for the class of digit number 1 when it's rotated while the class of digit number 0 is similar like its original when it's rotated.

enter image description here


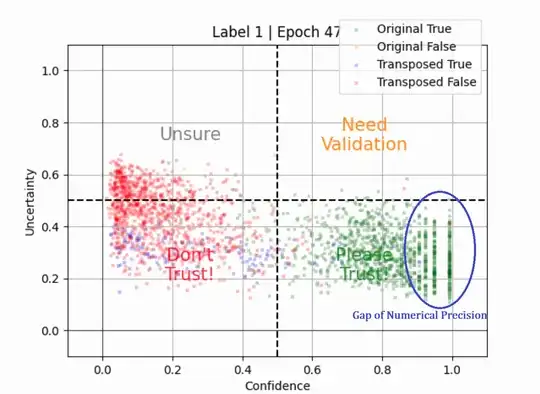
Performing a transformation of raw softmax output into a logarithmic scale would produce probabilities of I don't know vs. I know, like this class of digit number 1 below. Notice that there are gaps of numerical precision, as the most real number is represented by IEEE 754 in most computers, which has limited precision.

enter image description here


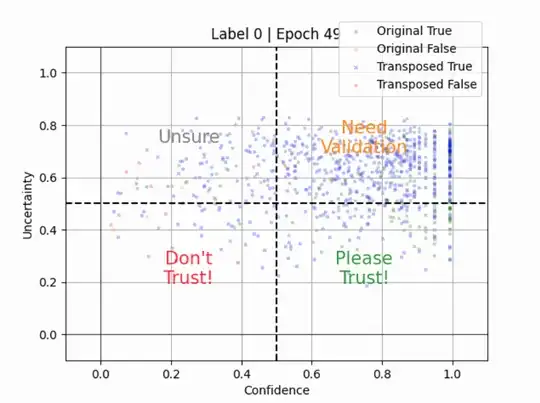
Same for the class of digit number 0 below as expected, it is mostly correct to predict its rotated version as it's similar to the original.

enter image description here


Here is the full formula:

Inputs:

  • Let $\mathbf{p} \in \mathbb{R}^{n_{\text{samples}} \times n_{\text{classes}}}$ be the input matrix of predicted probabilities, where:
    • $n_{\text{samples}}$ is the number of samples.
    • $n_{\text{classes}}$ is the number of classes (i.e., the number of possible predictions per sample).
    • Each element $p_{i,j} \in [0, 1]$ represents the predicted probability for sample $i$ and class $j$, and for each $i$, we have $\sum_{j=1}^{n_{\text{classes}}} p_{i,j} = 1$.

Definitions:

  • Let $N = n_{\text{classes}}$ denote the number of classes.
  • Let $\text{inf} = -\log_2(\epsilon)$ (where $\epsilon$ is the smallest representable number for the input's data type)
  • For each sample $i$, define:
    • The maximum predicted probability $a_i = \max_j (p_{i,j})$.
    • The minimum predicted probability $b_i = \min_j (p_{i,j})$.

Confidence:

For each sample $i$, the confidence is defined as:

$$ c_i = \log_2(N - 1) - \log_2(N) - \log_2(1 - a_i) $$

where $a_i = \max_j (p_{i,j})$ is the maximum predicted probability for sample $i$.

Specifically: The confidence for each sample is normalized as:

$$ c_i' = \frac{c_i}{\inf} $$

where $\inf$ is a large constant, representing the inverse of the smallest representable number of the data type, ensuring that the confidence is mapped to the range $[0, 1]$.


Uncertainty:

The uncertainty for each sample $i$ is defined as:

$$ u_i = -\log_2(N) - \log_2(b_i) - c_i $$

where $b_i = \min_j (p_{i,j})$ is the minimum predicted probability for sample $i$, and $c_i$ is the confidence for sample $i$.

Specifically: The uncertainty for each sample is normalized as:

$$ u_i' = \frac{u_i}{\inf} $$

where $\inf$ is the same large constant used for normalizing the confidence.

Then, the uncertainty is transformed as:

$$ u_i'' = \frac{2^{u_i'} - 1}{2^{u_i'} + 1} $$

This maps the uncertainty values to the range $[0, 1]$.


Outputs:

  • The output consists of two arrays:
    1. Confidence array $\mathbf{c}$: A normalized confidence value for each sample, where $c_i' \in [0, 1]$.
    2. Uncertainty array $\mathbf{u}$: A normalized uncertainty value for each sample, where $u_i'' \in [0, 1]$.

The final output is a matrix $\mathbf{output} \in \mathbb{R}^{n_{\text{samples}} \times 2}$, where each row contains the normalized confidence and uncertainty values for each sample.


Summary

So, you can say that the softmax output can represent the probability, except it represents the probability of I don't know this sample vs. I know this sample.