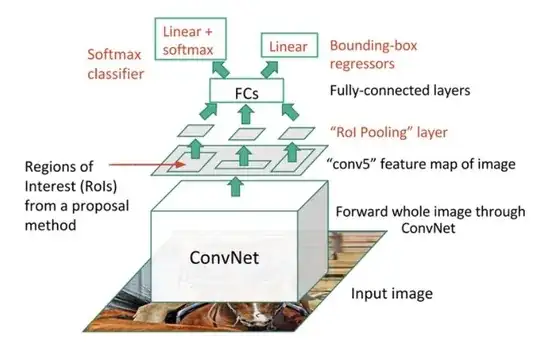
Yes, it is not specified because the region proposal algorithm did not change from R-CNN (the previous version from Fast R-CNN, however, in the next verion, Faster R-CNN, this algorithm is replaced by a CNN).
The region proposal algorithm you are looking for is called selective search. You can find in the R-CNN paper that the algorithm is described in "Selective Search for Object Recognition", I found a copy here.
The algorithm is based on a series of segmentation and aggregation techniques of the input image for generating the proposed regions. Check it out 4 iterations of segmentation & aggregation over the same input image to build the proposed regions.

All the algorithm is doing is just iterating over 4 steps:
- Initial regions based on segmentation by pixel light intensity are obtained by applying a segmentation algorithm described in the paper. For example, given a picture of a shepherd with his sheep in the mountain, it is segmented by light intensity, and the image of Figure (a) is obtained.
- Different regions are proposed based on the previous segmentation, Figure (e)
- The similarity between the proposed regions is calculated using the formula proposed in equation 6
in Section 3.2 in the paper which is nothing more than an aggregate metric of the similarity of two regions based in 4 metrics: similarity in color, texture, size and fill (measures how well a region within another)
- Add the regions based on similarity and get Figure (b). Then return to step two.
That is how iteratively you get all the images depicted.

