4

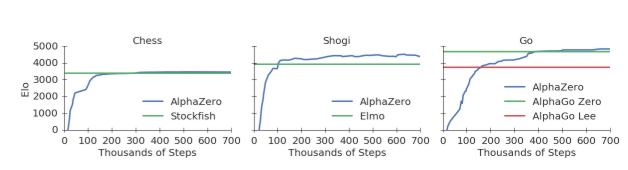
In training a neural network, you often see the curve showing how fast the neural network is getting better. It usually grows very fast then slows down to almost horizontal.

Is there a mathematical formula that matches these curves?

enter image description here

Some similar curves are:

$$y=1-e^{-x}$$

$$y=\frac{x}{1+x}$$

$$y=\tanh(x)$$

$$y=1+x-\sqrt{1+x^2}$$

Is there a theoretical reason for this shape?

zooby
  • 2,260
  • 1
  • 14
  • 22

1 Answers1

0

I don't think there's a theoretical reason for the shape, it's just showing the diminishing returns as training goes.

As for a mathematical function that describes this, exponential decay may fit well here (in case of loss, or inverse exponential decay if accuracy).

Also, I would not assume that this abrupt flat line of your examples are a universal.

talles
  • 146
  • 3