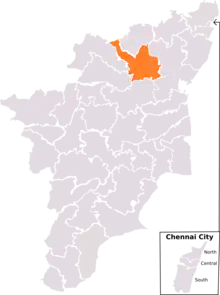
| Tiruvannamalai | |
|---|---|
| Lok Sabha constituency | |
 Area of Tiruvannamalai Lok Sabha Constituency | |
| Constituency details | |
| Country | India |
| Region | South India |
| State | Tamil Nadu |
| Assembly constituencies | Jolarpet Tirupattur Chengam Tiruvannamalai Kilpennathur Kalasapakkam |
| Established | 2008 |
| Total electors | 1,470,203 |
| Reservation | None |
| Member of Parliament | |
| 17th Lok Sabha | |
| Incumbent | |
| Party | DMK |
| Elected year | 2019 |
| Preceded by | R. Vanaroja |
Tiruvannamalai Lok Sabha constituency (Tamil: திருவண்ணாமலை மக்களவைத் தொகுதி) is one of the 39 Lok Sabha (parliamentary) constituencies in Tamil Nadu, a state in southern India. Its Tamil Nadu Parliamentary Constituency number is 11.
Assembly Segments
Tiruvannamalai Lok Sabha constituency comprises the following legislative assembly segments:
| Constituency number | Constituency name | Reserved for (SC/ST/None) | District | Party | |
|---|---|---|---|---|---|
| 49 | Jolarpet | None | Tirupathur | DMK | |
| 50 | Tirupattur | None | |||
| 62 | Chengam | SC | Tiruvannamalai | ||
| 63 | Tiruvannamalai | None | |||
| 64 | Kilpennathur | None | |||
| 65 | Kalasapakkam | None | |||
Members of the Parliament
| Year | Lok Sabha | Winner | Party | Tenure | |
|---|---|---|---|---|---|
| 2009 | 15th | D. Venugopal | Dravida Munnetra Kazhagam | 2009-2014 | |
| 2014 | 16th | R. Vanaroja | All India Anna Dravida Munnetra Kazhagam | 2014-2019 | |
| 2019 | 17th | C. N. Annadurai | Dravida Munnetra Kazhagam | 2019-Incumbent | |
Election results
General Elections 2019
| Party | Candidate | Votes | % | ±% | |
|---|---|---|---|---|---|
| DMK | Annadurai C N | 666,272 | 58.21% | 26.81% | |
| AIADMK | Agri S. S. Krishnamurthy | 3,62,085 | 31.64% | -15.70% | |
| Independent | A. Gnanasekar | 38,639 | 3.38% | ||
| NTK | R. Ramesh Babu | 27,503 | 2.40% | ||
| MNM | R. Arul | 14,654 | 1.28% | ||
| NOTA | None of the above | 12,317 | 1.08% | 0.17% | |
| Margin of victory | 3,04,187 | 26.58% | 10.64% | ||
| Turnout | 11,44,549 | 77.66% | -0.53% | ||
| Registered electors | 14,73,862 | 8.94% | |||
| DMK gain from AIADMK | Swing | 10.88% | |||
General Elections 2014
| Party | Candidate | Votes | % | ±% | |
|---|---|---|---|---|---|
| AIADMK | R. Vanaroja | 500,751 | 47.34% | ||
| DMK | Annadurai C N | 3,32,145 | 31.40% | -20.70% | |
| PMK | G. Ediroli Manian | 1,57,954 | 14.93% | ||
| INC | A. Subramaniyan | 17,854 | 1.69% | ||
| Independent | K. Murugesan | 10,708 | 1.01% | ||
| NOTA | None of the above | 9,595 | 0.91% | ||
| SP | C. Arumugam | 6,278 | 0.59% | ||
| Margin of victory | 1,68,606 | 15.94% | -1.75% | ||
| Turnout | 10,57,852 | 78.19% | -1.47% | ||
| Registered electors | 13,52,966 | 28.54% | |||
| AIADMK gain from DMK | Swing | -4.77% | |||
General Elections 2009
{{Election box registered electors |reg. electors = 8,38,481 #VALUE!
| Party | Candidate | Votes | % | ±% | |
|---|---|---|---|---|---|
| DMK | D. Venugopal | 436,866 | 52.10% | ||
| PMK | J. Guru (A) Gurunathan | 2,88,566 | 34.42% | ||
| DMDK | S. Manikandan | 56,960 | 6.79% | ||
| LJP | K. S. Afroz Husna | 5,798 | 0.69% | ||
| Independent | R. Ravi | 5,432 | 0.65% | ||
| Independent | M. Shanmugavel | 5,126 | 0.61% | ||
| Independent | S. Guru (A) Gurumoorthy | 4,927 | 0.59% | ||
| BSP | P. Govindasamy | 4,731 | 0.56% | ||
| Margin of victory | 1,48,300 | 17.69% | |||
| Turnout | 10,52,587 | 79.66% | |||
| Rejected ballots | 330 | 0.04% | |||
| DMK win (new seat) | |||||
General Elections 1962
| Party | Candidate | Votes | % | ±% | |
|---|---|---|---|---|---|
| DMK | Dharmalingam | 141,254 | 48.99% | ||
| INC | G. Neelakantan | 1,37,528 | 47.69% | 11.02% | |
| Independent | Arjuna Gounder | 9,574 | 3.32% | ||
| Margin of victory | 3,726 | 1.29% | -3.78% | ||
| Turnout | 2,88,356 | 66.61% | 19.28% | ||
| Registered electors | 4,49,968 | 5.46% | |||
| DMK gain from Independent | Swing | 7.24% | |||
General Elections 1957
| Party | Candidate | Votes | % | ±% | |
|---|---|---|---|---|---|
| Independent | Dharmalingam | 84,309 | 41.75% | ||
| INC | G. Neelakantan | 74,070 | 36.68% | ||
| Independent | T. P. Thayuman | 25,145 | 12.45% | ||
| Independent | N. Munisami | 18,436 | 9.13% | ||
| Independent | Doraiswamy Reddiar | 0 | 0.00% | ||
| Margin of victory | 10,239 | 5.07% | |||
| Turnout | 2,01,960 | 47.33% | |||
| Registered electors | 4,26,665 | ||||
| Independent win (new seat) | |||||
References
- "Statistical reports of Lok Sabha elections". Election Commission of India. Archived from the original on 5 October 2010. Retrieved 8 July 2010.
External links
This article is issued from Wikipedia. The text is licensed under Creative Commons - Attribution - Sharealike. Additional terms may apply for the media files.