San Patricio
Melaque | |
|---|---|
Locality | |
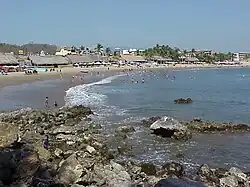 West end of the Melaque beach | |
 San Patricio 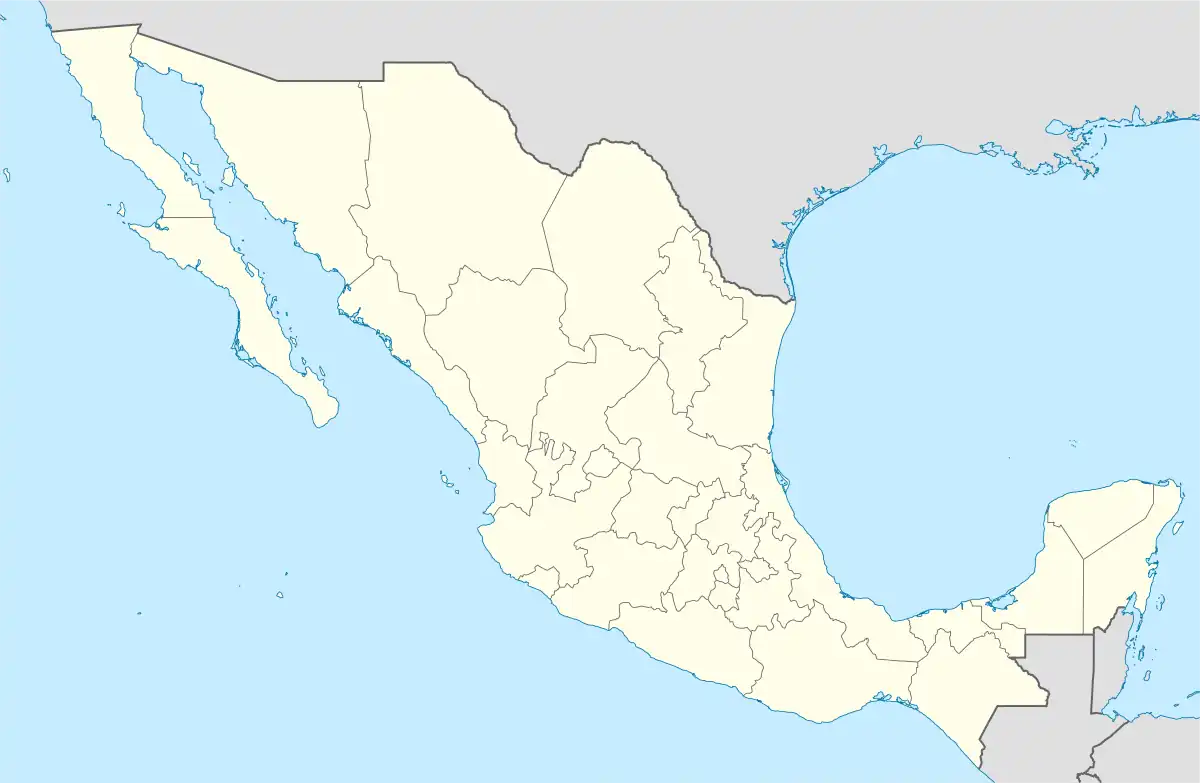 San Patricio | |
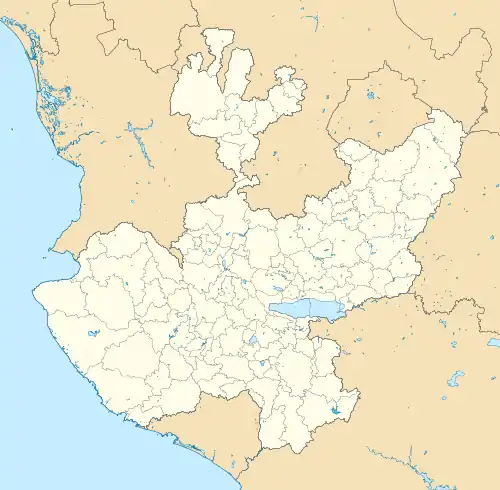
| Coordinates: 19°13′31″N 104°42′04″W / 19.22528°N 104.70111°W | |
| Country | |
| State | |
| Municipality | Cihuatlán |
| Area | |
| • Total | 2.15 km2 (0.83 sq mi) |
| Elevation | 12 m (39 ft) |
| Population (2020) | |
| • Total | 6,958 |
| • Density | 3,200/km2 (8,400/sq mi) |
| Time zone | UTC-6 (ZC) |
| • Summer (DST) | UTC-5 (ZC) |
| Postal code | 48980 |
| Telephone code | 315 |
San Patricio, also known as Melaque, is an urban locality in Cihuatlán, Jalisco, Mexico. As of the year 2020, it has a total population of 6,958.[1]
Geography
San Patricio is located on the southern coast of Jalisco, about 4 kilometers northwest of Barra de Navidad. It is bounded by Laguna del Tule to the east. Its average elevation is 12 meters above the sea level.[2]
Climate
San Patricio has Tropical Savanna Climate (Aw). It sees the least rainfall in April, with an average precipitation of 0.5 mm; and the most in September, with an average precipitation of 190.2 mm.
| Climate data for San Patricio | |||||||||||||
|---|---|---|---|---|---|---|---|---|---|---|---|---|---|
| Month | Jan | Feb | Mar | Apr | May | Jun | Jul | Aug | Sep | Oct | Nov | Dec | Year |
| Mean daily maximum °C (°F) | 28 (82) |
28 (82) |
27 (81) |
27 (81) |
29 (84) |
30 (86) |
31 (88) |
31 (88) |
31 (88) |
31 (88) |
30 (86) |
29 (84) |
29 (85) |
| Daily mean °C (°F) | 24 (75) |
23 (73) |
23 (73) |
24 (75) |
25 (77) |
27 (81) |
28 (82) |
28 (82) |
28 (82) |
28 (82) |
26 (79) |
25 (77) |
26 (78) |
| Mean daily minimum °C (°F) | 20 (68) |
19 (66) |
19 (66) |
20 (68) |
22 (72) |
24 (75) |
25 (77) |
25 (77) |
25 (77) |
24 (75) |
22 (72) |
21 (70) |
22 (72) |
| Average rainfall mm (inches) | 24.3 (0.96) |
13.1 (0.52) |
5.4 (0.21) |
0.5 (0.02) |
7.9 (0.31) |
86.0 (3.39) |
145.8 (5.74) |
168.2 (6.62) |
190.2 (7.49) |
82.9 (3.26) |
25.3 (1.00) |
9.8 (0.39) |
759.4 (29.91) |
| Average rainy days (≥ 1 mm) | 1.8 | 0.9 | 0.4 | 0.1 | 1.5 | 11.6 | 18.8 | 19.4 | 17.5 | 8.3 | 2.0 | 1.2 | 83.5 |
| Mean daily daylight hours | 11.1 | 11.5 | 12.1 | 12.6 | 13.1 | 13.3 | 13.1 | 12.7 | 12.2 | 11.7 | 11.2 | 11.0 | 12.1 |
| Source: Weatherspark.com[3] | |||||||||||||
External links
References
- ↑ "Jalisco (Mexico): Localities in Municipalities - Population Statistics, Charts and Map". www.citypopulation.de. Retrieved 4 June 2023.
- ↑ "San Patricio topographic map, elevation, terrain". Topographic maps. Retrieved 4 June 2023.
- ↑ "Climate and Average Weather Year Round in San Patricio, Mexico". weatherspark.com. Retrieved 4 June 2023.
This article is issued from Wikipedia. The text is licensed under Creative Commons - Attribution - Sharealike. Additional terms may apply for the media files.